How to make Combination chart in Blazor PivotChart?
Hi
I want to have two or more series types in a single PivotChart. But it seems like there's no way to setup in Blazor, like in ASP.NET.
Hi Thinh,
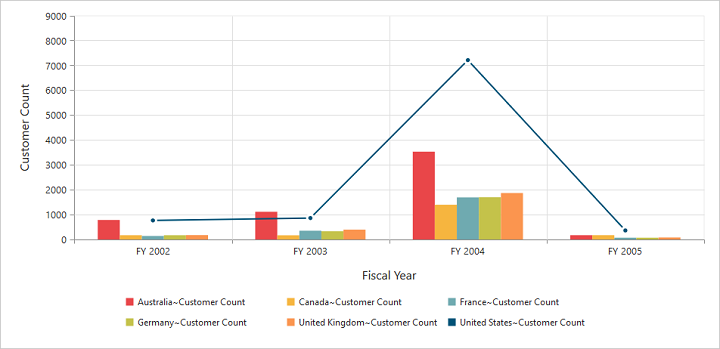
Yes, you can create a multi-series chart in the pivot table by using the ChartSeriesCreated event. Using the ChartSeriesCreated event, we set the series type to Line for the "Accessories" in the code below.
Code Example:
<SfPivotView> <PivotViewDataSourceSettings TValue="PivotProductDetails" ProviderType="ProviderType.SSAS" Catalog="Adventure Works DW 2008 SE" Cube="Adventure Works" Url=https://bi.syncfusion.com/olap/msmdpump.dll LocaleIdentifier="1033" EnableSorting="true"> <PivotViewColumns> <PivotViewColumn Name="[Product].[Product Categories]" Caption="Product Category"></PivotViewColumn> <PivotViewColumn Name="[Measures]" Caption="Measure"></PivotViewColumn> </PivotViewColumns> <PivotViewRows> <PivotViewRow Name="[Date].[Fiscal]" Caption="Date Fiscal"></PivotViewRow> <PivotViewRow Name="[Customer].[Customer Geography]" Caption="Customer Geography"></PivotViewRow> </PivotViewRows> <PivotViewValues> <PivotViewValue Name="[Measures].[Customer Count]" Caption="Customer Count"></PivotViewValue> </PivotViewValues> </PivotViewDataSourceSettings> <PivotChartSettings Title="Sales Analysis" > <PivotChartSeries Type="ChartSeriesType.Column"></PivotChartSeries> </PivotChartSettings> <PivotViewEvents TValue="PivotProductDetails" ChartSeriesCreated="ChartSeriesCreated"></PivotViewEvents> </SfPivotView>
@Code {
public void ChartSeriesCreated(ChartSeriesCreatedEventArgs args) { for (var i = 0; i < args.Series.Count; i++) { if (args.Series[i].Name == "Accessories") { args.Series[i].Type = Syncfusion.Blazor.Charts.ChartSeriesType.Line; // Here we have displayed Accessories series as Line chart. } } } } |
However, we are currently experiencing problems with displaying multi-series on our pivot chart and we are validating this issue now. We will update you with further details on Monday (17th July,2023).
We appreciate your patience until then.
With regards,
Rajeshkannah G
Hi Thinh,
We have considered the reported issue as a bug “Series type not changed while using "ChartSeriesCreated" event in the Pivot chart” and this issue will be included in the Volume 2 SP release which is scheduled to be rolled out by end of July,2023. You can track the status using the below feedback link .
We appreciate your patience until then.
Regards,
Rajeshkannah G
Hi Anand,
We are glad to announce that our Essential Studio 2023 Volume 2 Service Pack Release V22.2.5 is rolled out and the fix of the issue “Series type not changed while using ChartSeriesCreated event in the Pivot chart” has been included in this release. Please refer the below code example.
Code Example
|
<SfPivotView> <PivotViewDataSourceSettings TValue="PivotProductDetails" ProviderType="ProviderType.SSAS" Catalog="Adventure Works DW 2008 SE" Cube="Adventure Works" Url=https://bi.syncfusion.com/olap/msmdpump.dll LocaleIdentifier="1033" EnableSorting="true"> <PivotViewColumns> <PivotViewColumn Name="[Product].[Product Categories]" Caption="Product Category"></PivotViewColumn> <PivotViewColumn Name="[Measures]" Caption="Measure"></PivotViewColumn> </PivotViewColumns> <PivotViewRows> <PivotViewRow Name="[Date].[Fiscal]" Caption="Date Fiscal"></PivotViewRow> <PivotViewRow Name="[Customer].[Customer Geography]" Caption="Customer Geography"></PivotViewRow> </PivotViewRows> <PivotViewValues> <PivotViewValue Name="[Measures].[Customer Count]" Caption="Customer Count"></PivotViewValue> </PivotViewValues> </PivotViewDataSourceSettings> <PivotChartSettings Title="Sales Analysis" > <PivotChartSeries Type="ChartSeriesType.Column"></PivotChartSeries> </PivotChartSettings> <PivotViewEvents TValue="PivotProductDetails" ChartSeriesCreated="ChartSeriesCreated"></PivotViewEvents> </SfPivotView>
@Code {
public void ChartSeriesCreated(ChartSeriesCreatedEventArgs args) { for (var i = 0; i < args.Series.Count; i++) { if (args.Series[i].Name == "Accessories") { args.Series[i].Type = Syncfusion.Blazor.Charts.ChartSeriesType.Line; // Here we have displayed Accessories series as Line chart. } } } }
|
Meanwhile, we have prepared a sample for your reference, please find it in the attachments.
Output Screenshot

Please find the release notes below.
Release Notes : https://blazor.syncfusion.com/documentation/release-notes/22.2.5?type=all#pivot-table
Please let us know if you have any queries.
Regards,
Rajeshkannah G
Attachment: Pivot_Table_4205a7fa.zip
Thank you!
How do I change style of series in ChartSeriesCreated method?
Hi Thinh,
We would like to inform you that we can currently customize the chart series’ Type, Fill color, X axis name, and Y axis name only in the ChartSeriesCreated event. Please look at the code example below.
Code Example:
|
<SfPivotView TValue="ProductDetails"> <PivotViewDisplayOption View=View.Chart></PivotViewDisplayOption> <PivotChartSettings Title="Sales Analysis"> <PivotChartSeries Type="ChartSeriesType.Column"></PivotChartSeries> </PivotChartSettings> <PivotViewEvents TValue="ProductDetails" ChartSeriesCreated="ChartSeriesCreated"></PivotViewEvents> </SfPivotView>
@code { public void ChartSeriesCreated(ChartSeriesCreatedEventArgs args) { for (var i = 0; i < args.Series.Count; i++) { if (args.Series[i].Name == "Accessories") { args.Series[i].Fill = “Red”; args.Series[i].XAxisName = “ Custom X-Axis name”; args.Series[i].XAxisName = “Customer Y-Axis name” } } } |
Meanwhile, you can use other options such as Opacity, DashArray , Trendlines etc., to customize the chart series by using the PivotChartSeries properties through code-behind. Please look at the code example below.
Code Example
|
<SfPivotView TValue="ProductDetails"> <PivotViewDisplayOption View=View.Chart></PivotViewDisplayOption> <PivotViewDisplayOption View=View.Chart></PivotViewDisplayOption> <PivotChartSettings Title="Sales Analysis"> <PivotChartSeries Fill=”Red” Opacity=0.5 DashArray=”5,5” Type=ChartSeriesType.Column> // Other major options are: // <PivotChartCornerRadius TopLeft=20 TopRight=20 BottomLeft=10 BottomRight=10></PivotChartCornerRadius> // <PivotChartSeriesAnimation Enable="true" Duration=500></PivotChartSeriesAnimation> </PivotChartSeries> </PivotChartSettings> </SfPivotView> |
Output screenshot:

Meanwhile we have prepared a sample for your reference. Please find it in the attachments.
For more details about chart series customization, please refer the UG documentation links below.
Document : https://blazor.syncfusion.com/documentation/pivot-table/pivot-chart#series-customization
Please let us know if you have any concerns.
With regards,
Rajeshkannah G
Attachment: Pivot_Table_249c168f.zip
- 5 Replies
- 2 Participants
-
TH Thinh
- Jul 14, 2023 05:04 AM UTC
- Aug 1, 2023 12:49 PM UTC

