Try Our Live Demo
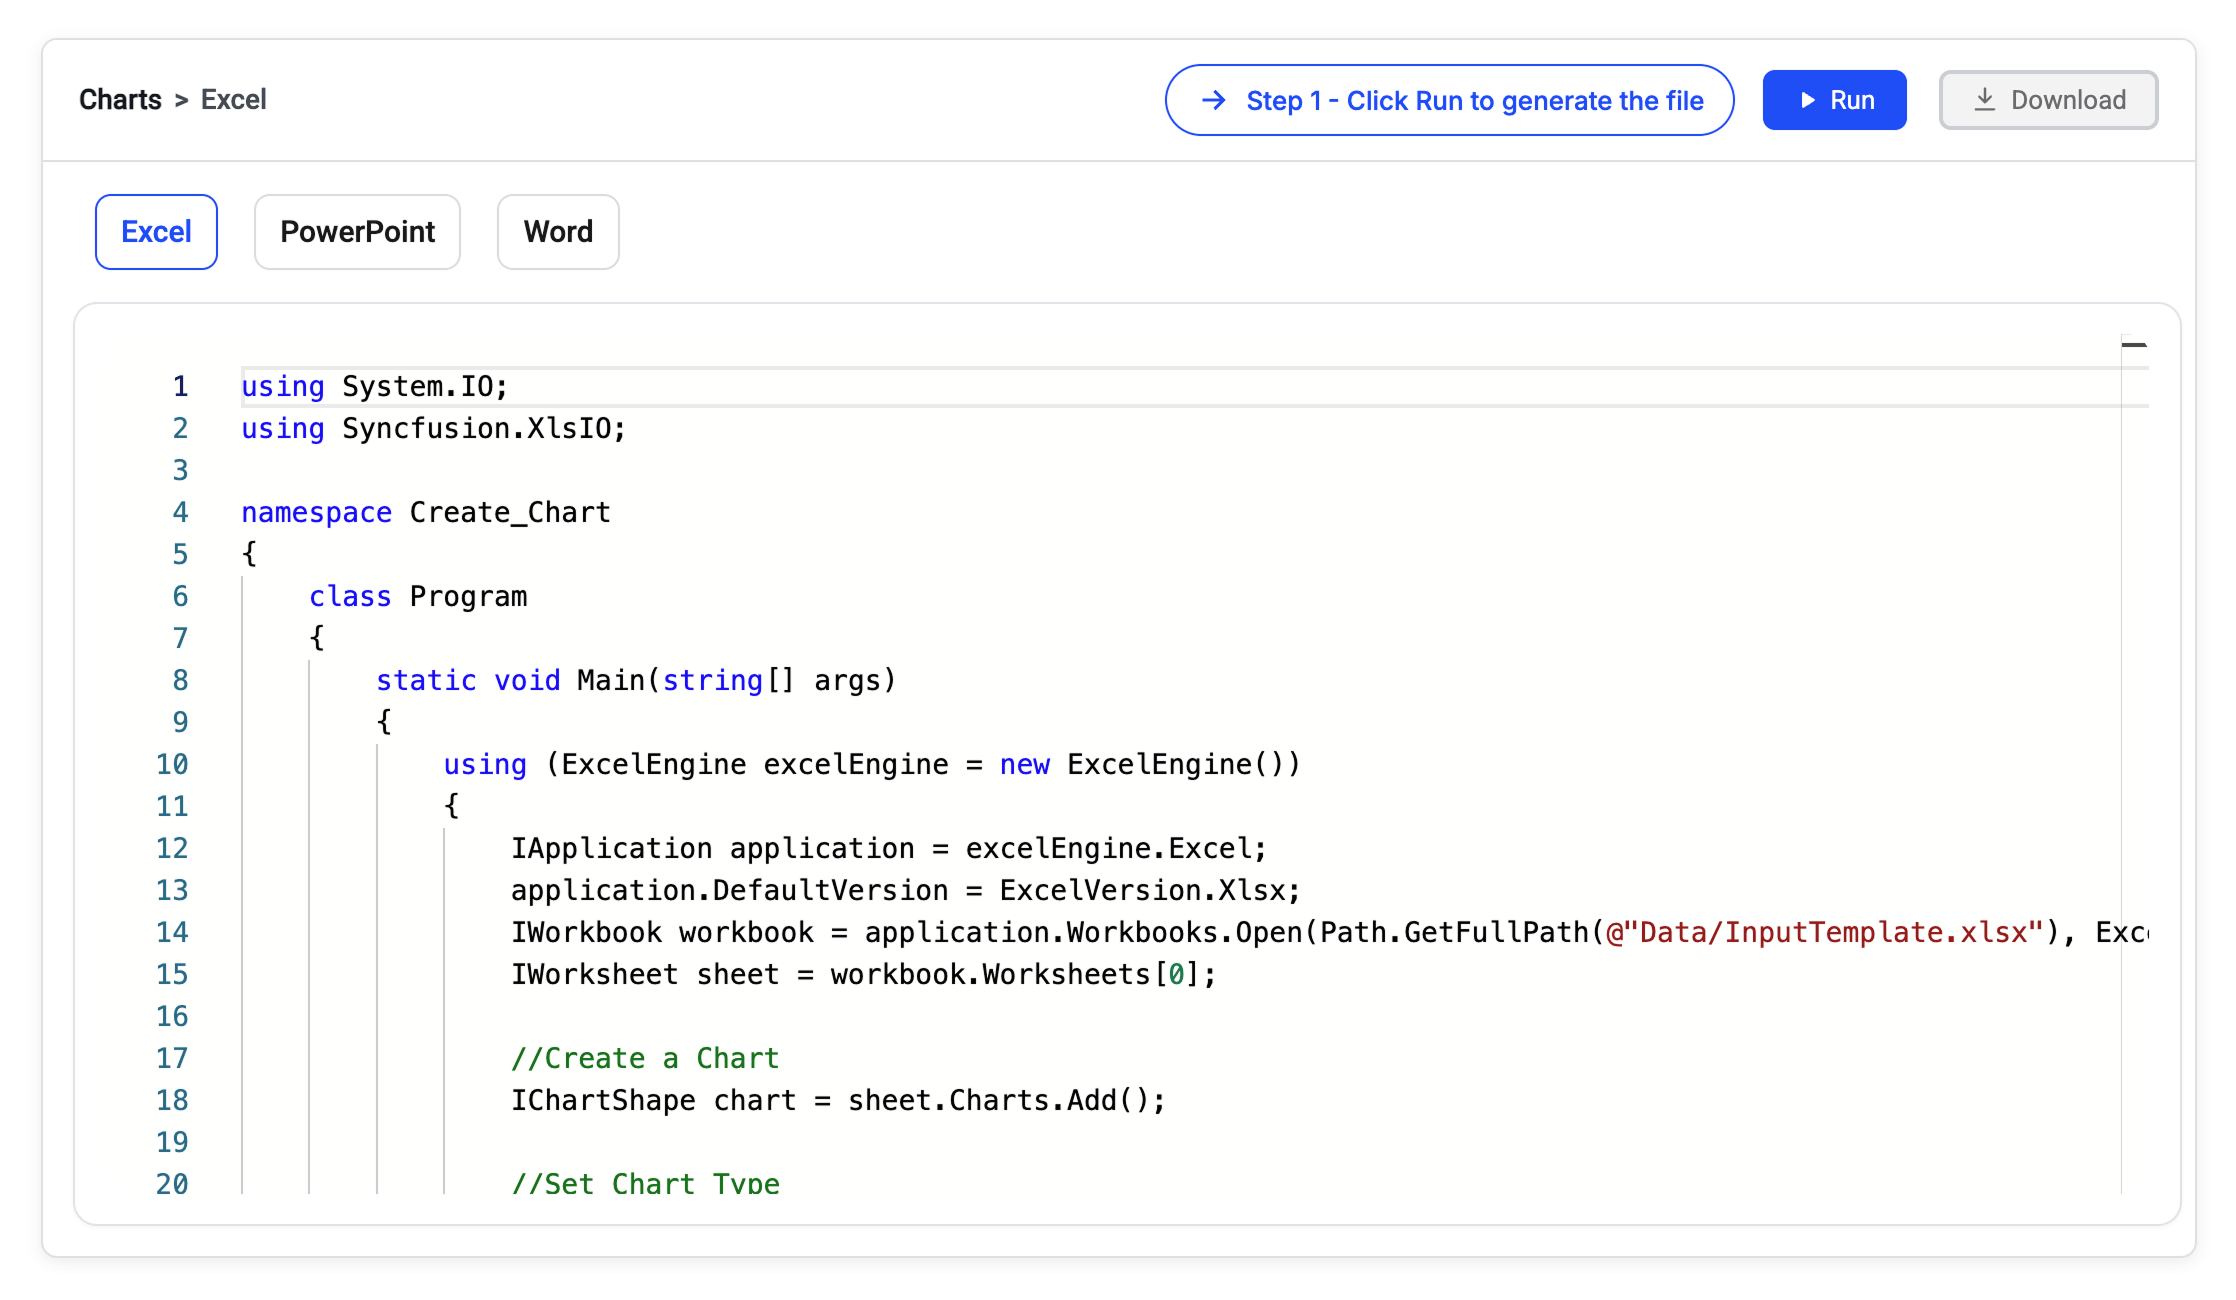
Create, customize, and export charts
Generate charts from data, apply custom formatting, and export high-quality chart images for reports, presentations, and business documents.
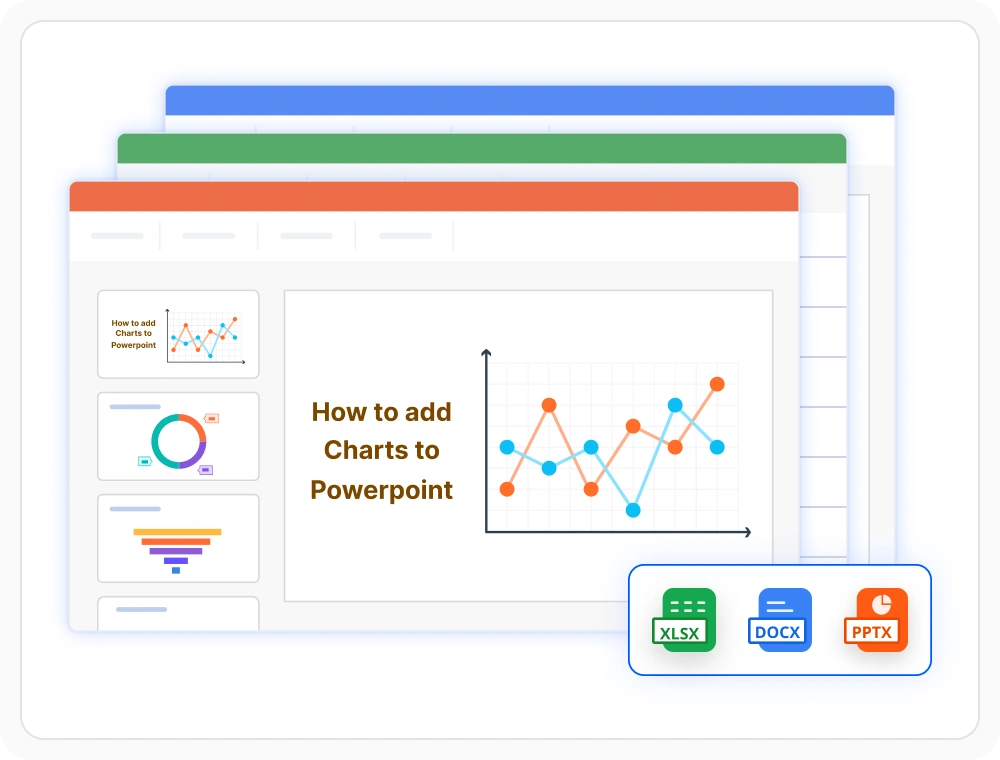
Create charts from data
Create and customize various chart types using spreadsheet, database, or application data. Use it when business information needs to be communicated through visual representations.
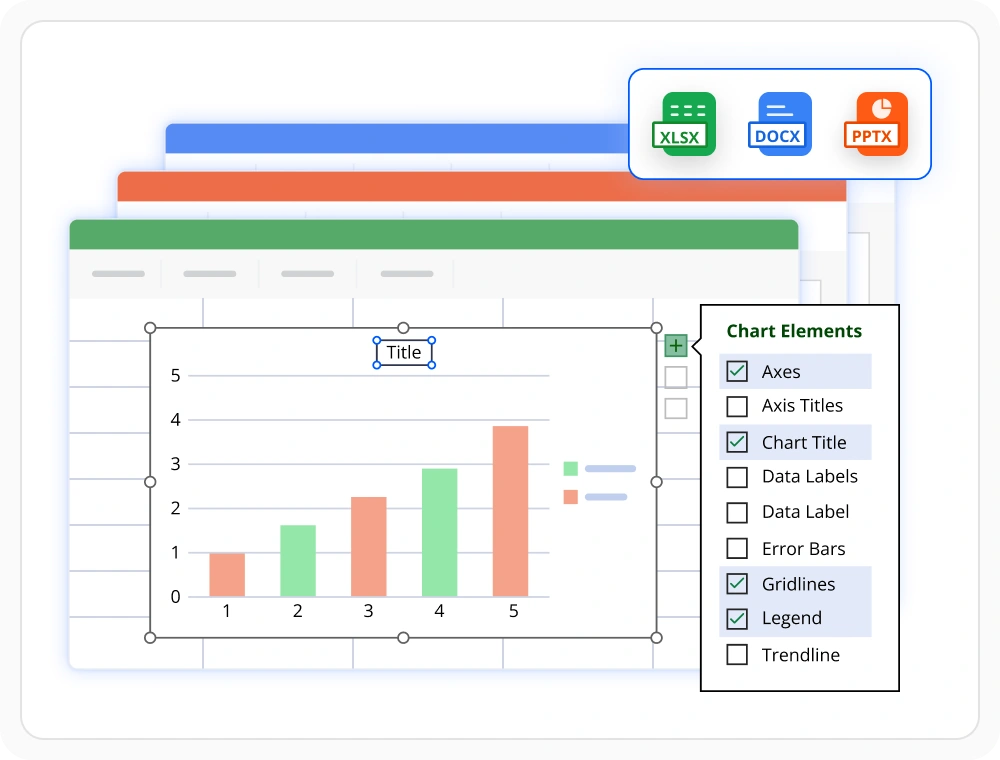
Customize chart appearance
Apply visual styling programmatically to chart titles, axes, data labels, series colors, and plot areas. Use it when consistent and professional chart formatting is required across documents and reports.
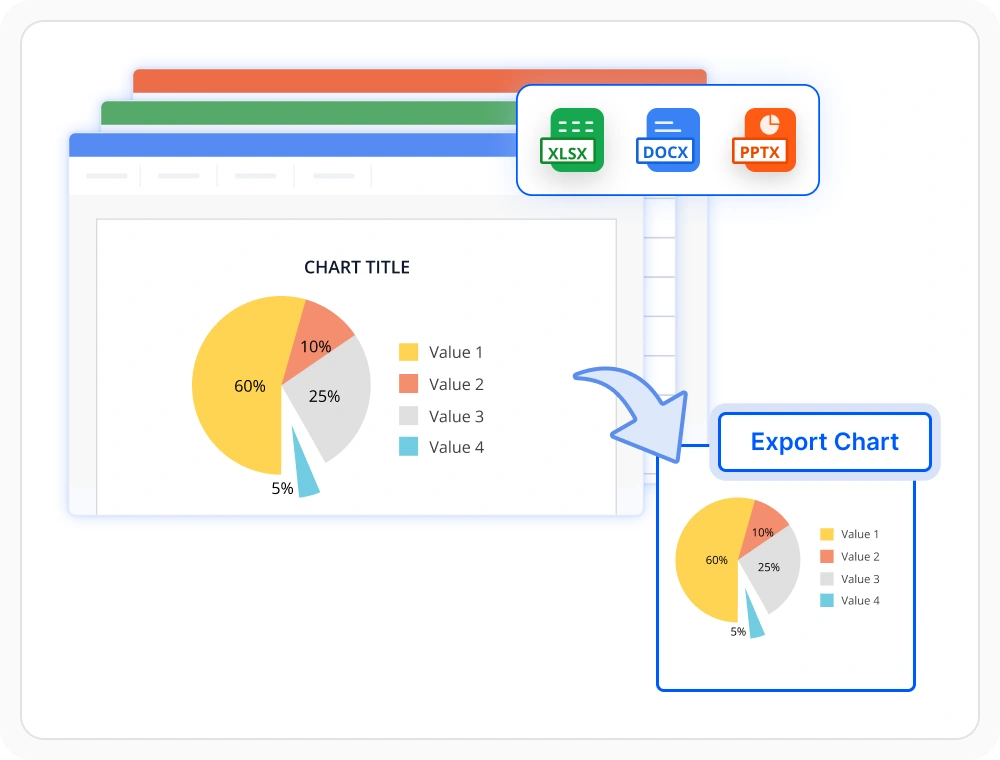
Export charts as images
Convert charts into high-quality images while preserving visual accuracy and formatting. Use this feature when visualizations need to be reused outside their original document format.
Chart supported libraries
Choose the right document library
Select the library that matches your application’s document format and processing needs. Use Word, Excel, or PowerPoint independently for focused requirements, or combine multiple libraries to build complete document solutions.
Word library
Add charts directly into Word documents to pair data visuals with written content. Use it when reports, proposals, or analysis documents need integrated chart and text layouts.
Excel library
Generate charts within Excel workbooks from live or imported spreadsheet data. Use it when financial, operational, or analytical reports require embedded chart visualizations.
PowerPoint library
Embed charts within PowerPoint slides to deliver data-driven presentations to stakeholders. Use it when application data must be organized into visually engaging slide content.
Frameworks: .NET
Frequently Asked Questions
Can Document SDK generate charts without Microsoft Office?
Yes. The Document SDK creates, customizes, and converts charts in Word, Excel, and PowerPoint documents without requiring Microsoft Office or Office Interop. All chart operations run entirely through managed .NET code on Windows, Linux, Docker, Azure, and AWS environments.
Does the Document SDK support advanced and modern chart types?
The Document SDK supports bar, line, pie, doughnut, scatter, radar, waterfall, histogram, tree map, sunburst, and many other chart types. It also includes modern Office 2016 chart types across Word, Excel, and PowerPoint libraries.
Which chart elements can be customized in Document SDK?
Chart titles, legends, labels, axes, plot areas, chart areas, data series, colors, borders, transparency, and other visual elements can all be configured.
Can Document SDK charts be created from business data automatically?
Yes. Charts can be generated using data from business applications, databases, reports, templates, or spreadsheets. This makes it practical to automate dashboards, financial reports, sales summaries, operational reports, and presentation content as part of recurring document workflows.
Can Document SDK reuse charts across different document formats?
Yes. Charts can be created from data and reused across multiple document formats by exporting them as images. A single visualization can be exported and inserted into Word, PowerPoint, PDF, and business reports, ensuring consistency across outputs.
Does Document SDK support combination charts for mixed data series?
Yes. Combination charts display different data series using different chart types within a single chart. For example, combining column and line charts to show sales volume alongside growth rate.
Resources
Learn more about our Document SDK
Explore demos, KB articles, and documentation to get the most out of our Document SDK.
Explore guides, APIs, and quick-start tips
See live use cases in action
Ask, share, and connect with peers
Find solutions and best practices fast
Get expert help when you need it
Feature requests and bug reports
Track issues and suggest improvements
Awards
Greatness—it’s one thing to say you have it, but it means more when others recognize it. Syncfusion® is proud to hold the following industry awards.