Try Our Live Demo
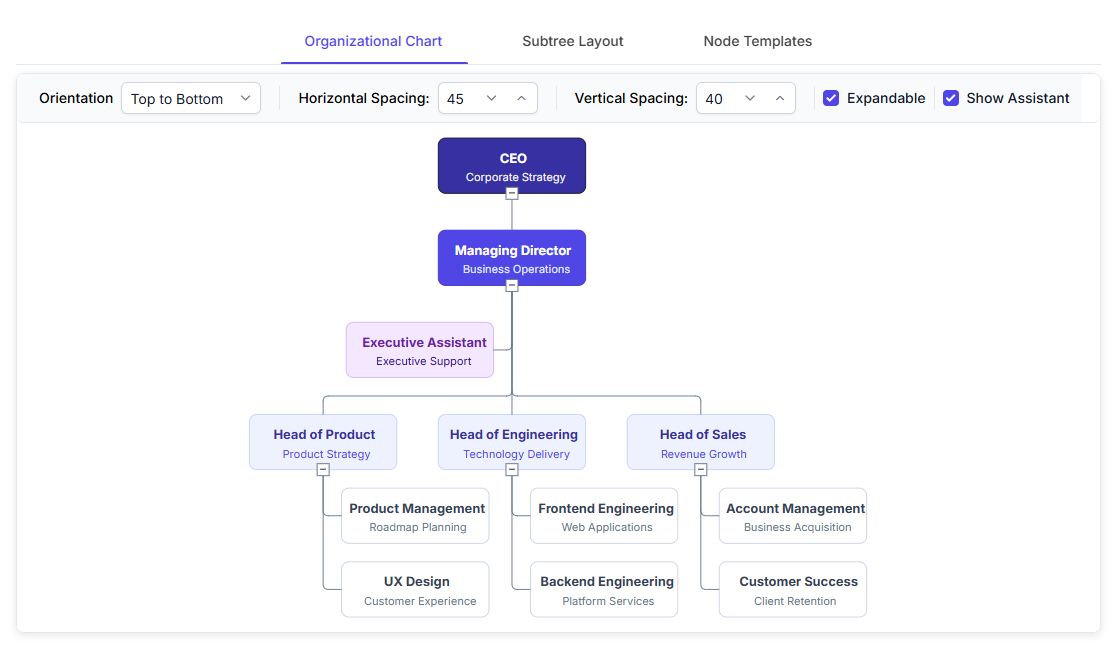
Why the organizational chart layout matters
A reporting structure has its own conventions, top-down hierarchy, aligned reporting lines, and the occasional role that doesn’t fit neatly into the chain of command. A purpose-built layout handles all of it.
Purpose-built for reporting lines
The layout is designed around how a reporting structure is actually drawn, not adapted from a generic tree.
Big charts stay manageable
Collapsing a branch or adjusting alignment keeps a chart with hundreds of roles readable instead of overwhelming.
Change the structure by dragging
Moving someone to a new manager is a drag, not a rebuild of the chart.
Layout built for org charts
Rather than reusing the generic tree layout, the organizational chart layout is a dedicated algorithm built around how reporting structures are usually drawn. Use this layout when a reporting structure needs to be arranged with its own conventions rather than a generic tree arrangement.
- Start from a root and arrange each node’s children automatically down through the hierarchy
- Build from manually created nodes and connectors, or from a data source describing who reports to whom
- Support orientation, alignment, and assistant positions specific to reporting structures
- Provide a distinct algorithm separate from the generic tree arrangement covered in Automatic Layouts
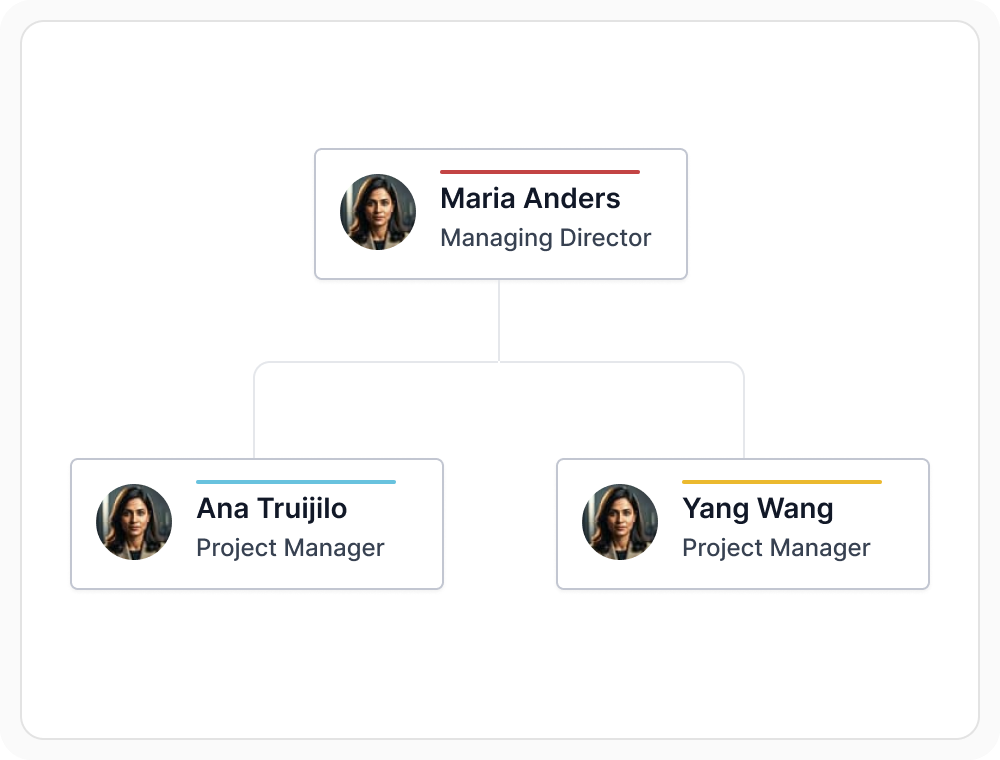
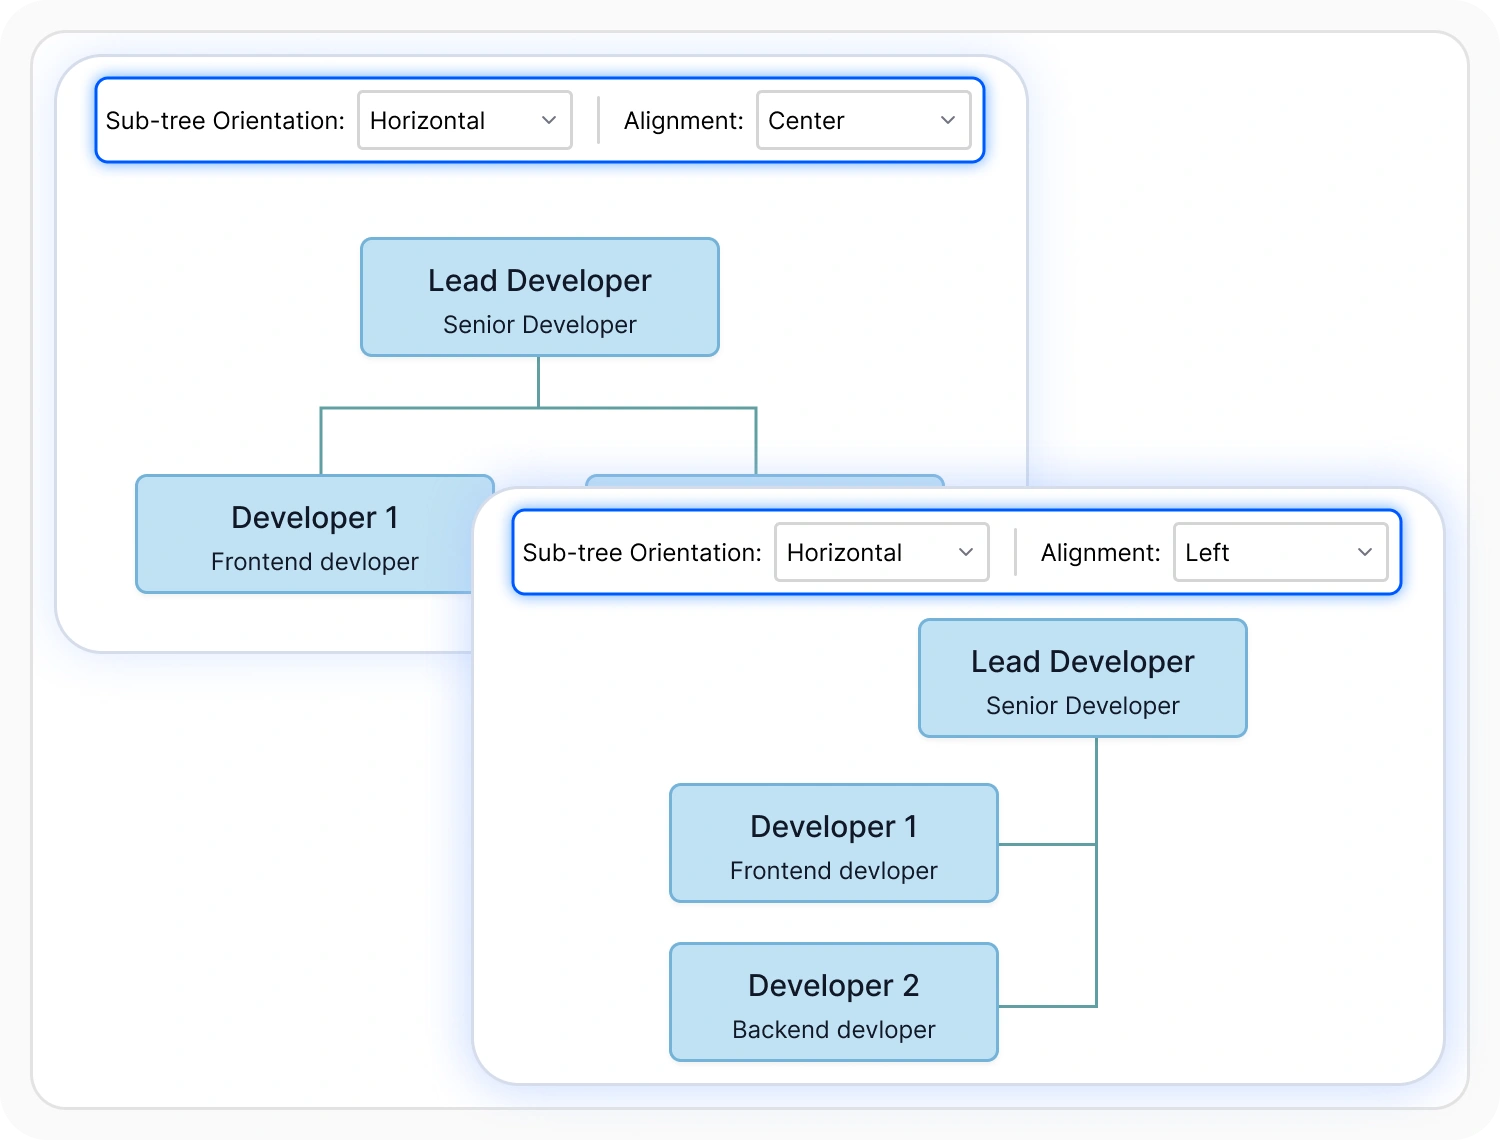
Orientation and alignment
The overall direction of the chart, and how the lowest-level nodes line up, can both be adjusted. Use these controls when a chart’s visual direction or leaf alignment needs to be fine-tuned for readability.
- Support the chart running top-to-bottom, bottom-to-top, left-to-right, or right-to-left
- Provide leaf-level node alignment to the left, right, or center horizontally, or to the top, bottom, or middle vertically
- Enable orientation and alignment to be set differently for each subtree, not just the chart as a whole
- Ensure adjustable spacing between levels and a margin around the whole chart
Assistant positions
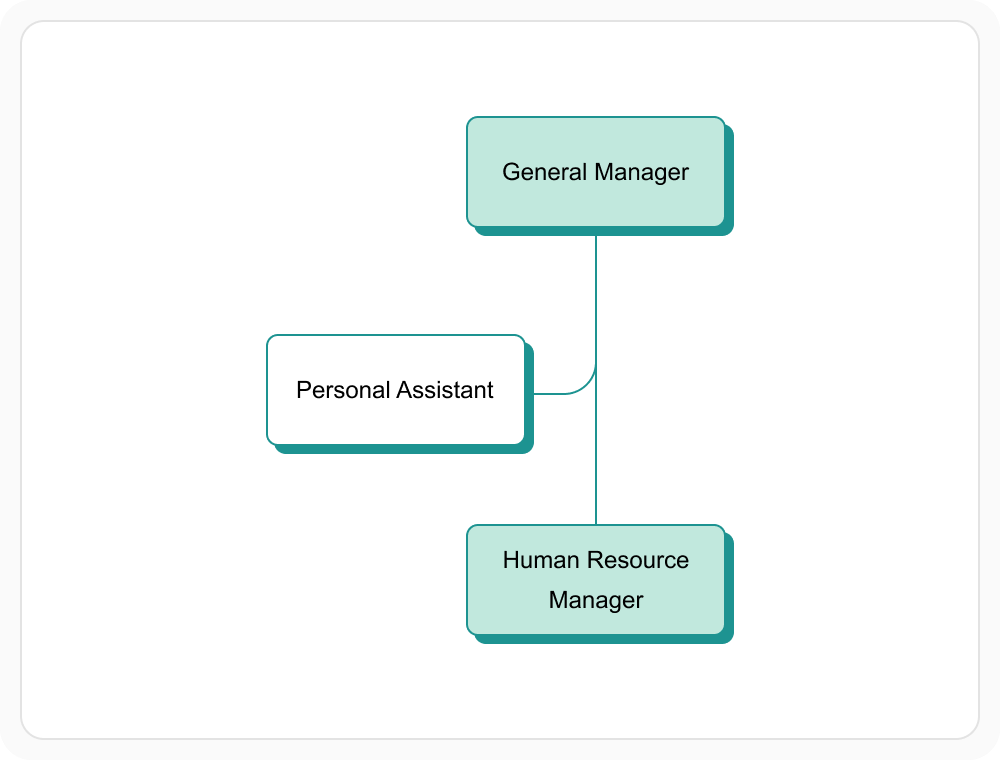
Not every role reports in a straight line. A node can be marked as an assistant instead of a regular child, placing it in its own dedicated position next to its manager. Use an assistant position when a role supports a manager without being part of the standard reporting hierarchy.
- Support laying out an assistant separately from regular reporting-line children
- Ensure an assistant node cannot have children of its own
- Deliver this layout for roles like an executive assistant or an advisory position that supports a manager without being part of the reporting hierarchy
- Provide assistant node positioning across JavaScript, Angular, React, Vue, Blazor, ASP.NET Core, MVC, WPF, and UWP platforms
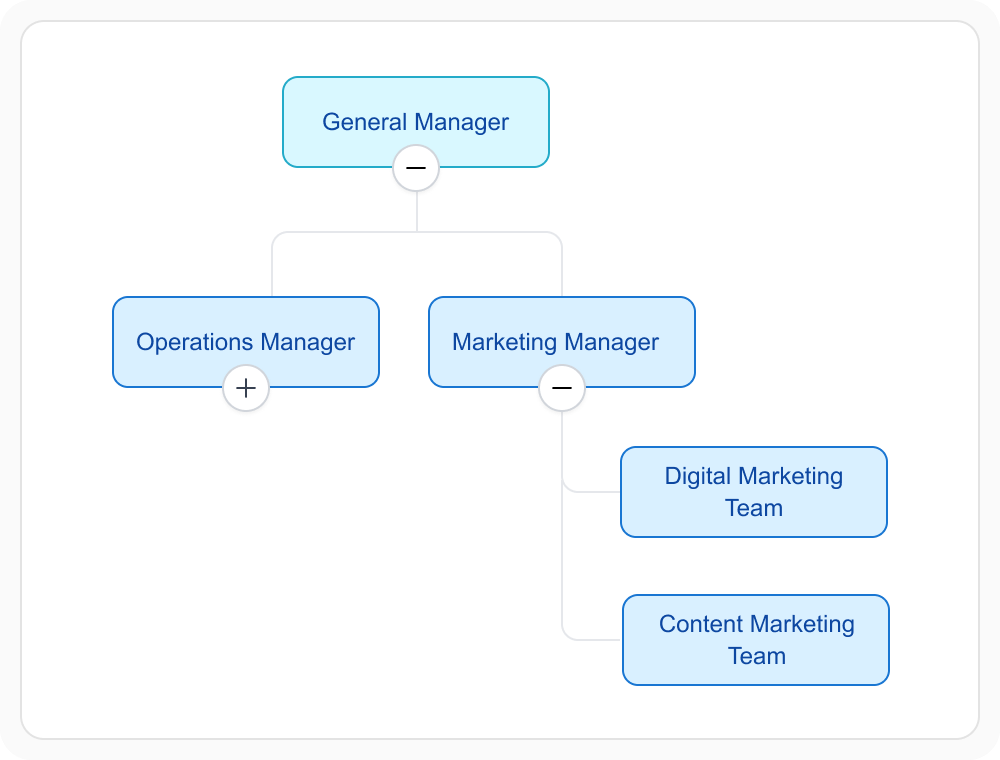
Expanding and collapsing branches
A large organizational chart can be simplified by collapsing a branch down to its top node, hiding everyone below it until it’s expanded again. Use expand and collapse when a large chart needs to be navigated one section at a time without permanently removing structure.
- Support collapsing a node to hide its children without removing them from the chart
- Provide an expand or collapse icon on the node to toggle this state
- Enable focus on one part of a large chart without permanently hiding the rest of the structure
- Ensure expand and collapse remains available across supported web and desktop platforms
PLATFORM SUPPORT
Organizational chart support by platform
The organizational chart layout is documented as a dedicated algorithm on every Diagram SDK platform, though some finer capabilities are confirmed more consistently than others. JavaScript, Angular, React, Vue, ASP.NET Core, ASP.NET MVC, and Blazor configure it through a shared layout type, while WPF, UWP, and Windows Forms provide the same algorithm through their own layout classes.
| Capability | JavaScript frameworks | ASP.NET Core and MVC | Blazor | WPF | UWP | Windows Forms |
|---|---|---|---|---|---|---|
| Organizational chart layout algorithm | ||||||
| Orientation and leaf-level alignment options | ||||||
| Assistant node positions | ||||||
| Interactive drag-to-reorganize |
Frequently Asked Questions
How is the organizational chart layout different from the generic hierarchical layout?
Both arrange nodes into a tree, but the organizational chart layout is a dedicated algorithm built around reporting-structure conventions, such as assistant positions and leaf-level alignment, that the generic hierarchical layout doesn’t have; see Automatic Layouts.
What is an assistant node, and how is it different from a regular child node?
An assistant is laid out in its own dedicated position next to its manager rather than in the regular reporting line, and it can’t have children of its own. It suits roles like an executive assistant that support a manager without being part of the standard hierarchy.
Can an employee be moved to a different manager after the chart is built?
Yes, where interactive drag-to-reorganize is supported. Dragging a node onto a new parent updates its reporting relationship, and the layout rearranges the affected part of the chart automatically.
Can the direction of the chart be changed, such as left to right instead of top to bottom?
Yes. The chart can run top-to-bottom, bottom-to-top, left-to-right, or right-to-left, and this can be set differently for individual subtrees as well as the chart overall.
Can part of a large organizational chart be hidden to simplify the view?
Yes. Collapsing a node hides its children without removing them, and expanding it brings them back into view, which helps keep a chart with many levels readable.
Is organizational chart support identical across every platform?
No. The core layout algorithm is documented everywhere, but assistant positions and interactive drag-to-reorganize are confirmed more consistently on some platforms than others, as shown in the table above.
Resources
Learn more about our Diagram SDK
Explore demos, documentation, and support resources to get the most out of the Syncfusion Diagram SDK.
Review shared concepts and supported platforms
Representative organizational chart demo
See orientation and structure customization in action
Ask, share, and connect with peers
Find solutions and best practices fast
Get expert help when needed
Feature requests and bug reports
Track issues and suggest improvements
Awards
Greatness—it’s one thing to say you have it, but it means more when others recognize it. Syncfusion® is proud to hold the following industry awards.