Skip to content
Blogs
Search blogs
Select Categories
Financial Dashboards
10 min read
Nov 27, 2025
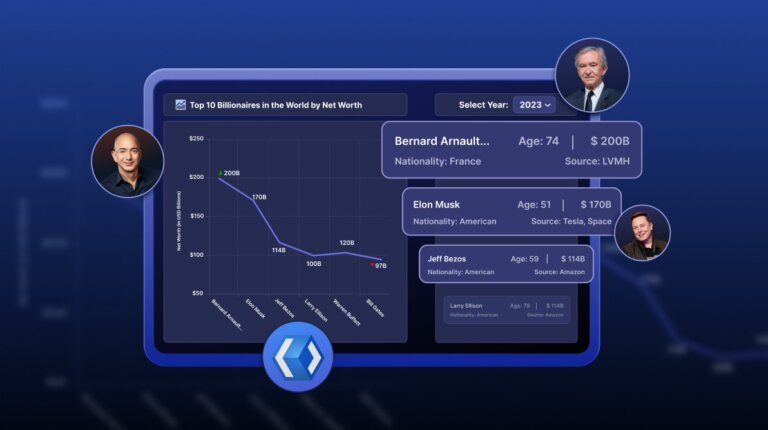
Build an AI-Powered WinUI Line Chart to Visualize the Wealth of Billionaires
Baranibharathi Pandian
15 min read
Sep 1, 2025
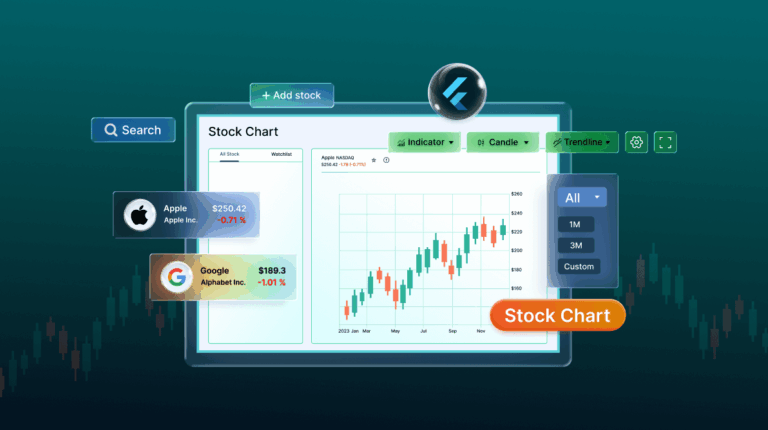
Getting Started with Stock Charts: Exploring the Core Features
Hariram Subramanian
12 min read
Jul 24, 2025
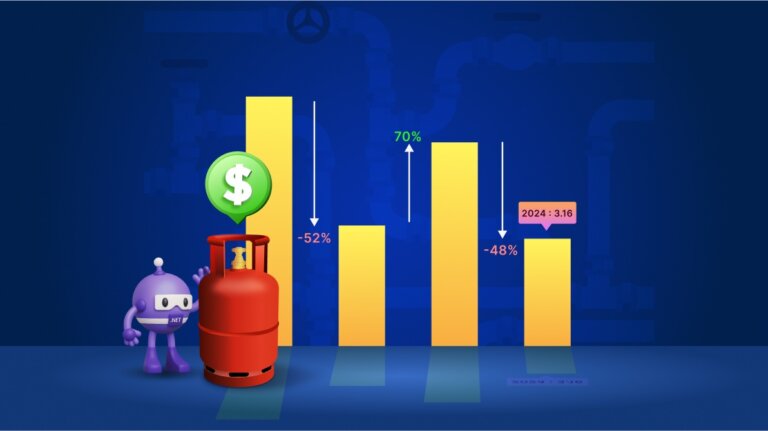
How to Build Variance Indicators Using .NET MAUI Toolkit Charts for Natural Gas Price Volatility
Kompelli Sravan Kumar Kompelli Lakshman
 Baranibharathi Pandian
 Hariram Subramanian
 Kompelli Sravan Kumar Kompelli Lakshman