
Welcome to another edition of Chart of the Week!
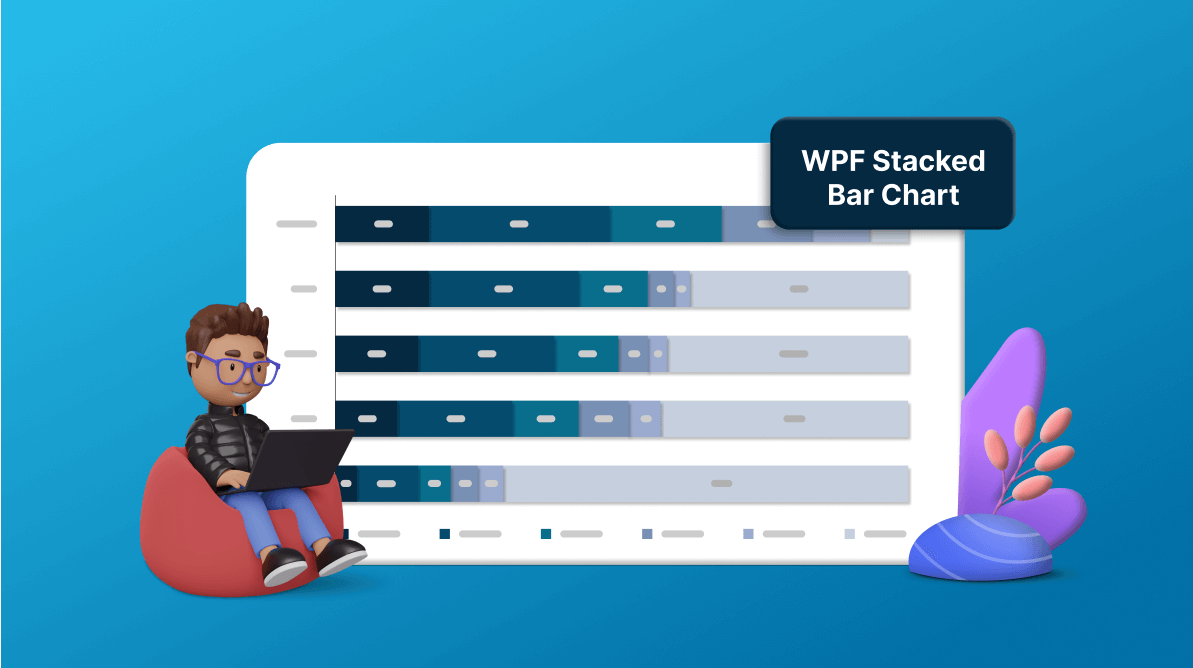
In this blog, we’ll visualize the social media use of U.S. teens in 2023 using Syncfusion’s WPF stacked bar chart. The chart in the following image is what we want to recreate.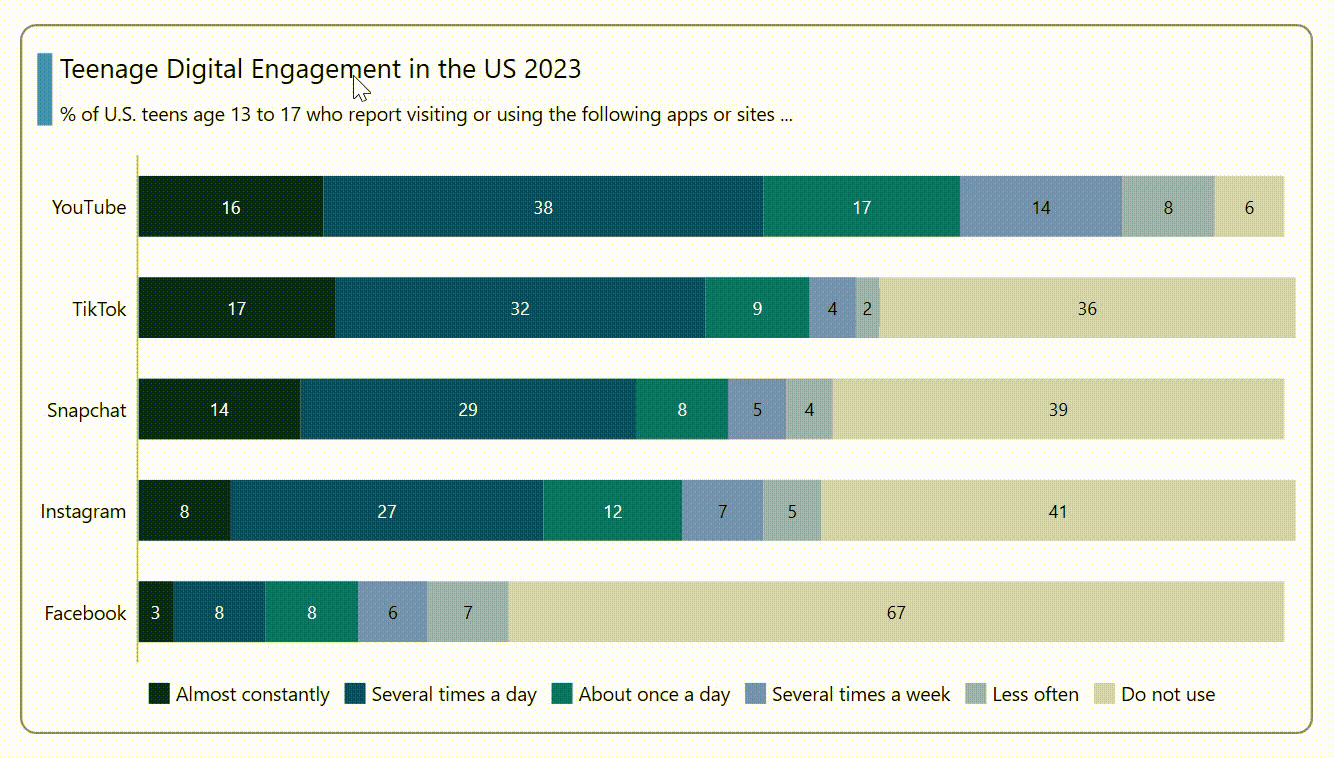
Let’s get started!
Step 1: Collecting data
First, we’ll collect data on how teenagers in the U.S. (13–17 years old) use social media from a recent Pew Research Center survey that was carried out in September and October of 2023.
Step 2: Organizing data for the chart
Let’s create a Model class that includes the properties for storing information about the categories of smartphone apps and their usage.
Refer to the following code example.
public class Model
{

    public string Category { get; set; }

    public double AlmostConstantly { get; set; }

    public double SeveralTimesADay { get; set; }

    public double AboutOnceADay { get; set; }

    public double SeveralTimesAWeek { get; set; }

    public double LessOften { get; set; }

    public double DoNotUse { get; set; }

    public Model(string category, double almostConstantly, double severalTimesADay, double aboutOnceADay, double severalTimesAWeek, double lessOften, double doNotUse)
    {
        Category = category;
        AlmostConstantly = almostConstantly;
        SeveralTimesADay = severalTimesADay;
        AboutOnceADay = aboutOnceADay;
        SeveralTimesAWeek = severalTimesAWeek;
        LessOften = lessOften;
        DoNotUse = doNotUse;
    }
}
Next, we generate the data collection using the ViewModel class and its Collection property. Then, assign the CSV data collection using the ReadCSV method, which stores it in the Collection property.
Refer to the following code example.
public class ViewModel : INotifyPropertyChanged
{
    private ObservableCollection<Model> collection;
    public ObservableCollection<Model> Collection
    {
        get { return collection; }
        set
        {
            collection = value;
            NotifyPropertyChanged();
        }
    }

    public ViewModel()
    {
        Collection = new ObservableCollection<Model>(ReadCSV("WPFStackingBarChart.teenwithsocialmedia.csv"));
    }

    public event PropertyChangedEventHandler? PropertyChanged;

    public void NotifyPropertyChanged([CallerMemberName] String propertyName = "")
    {
        PropertyChanged?.Invoke(this, new PropertyChangedEventArgs(propertyName));
    }

    public IEnumerable<Model> ReadCSV(string fileName)
    {
        Assembly executingAssembly = typeof(App).GetTypeInfo().Assembly;
        Stream inputStream = executingAssembly.GetManifestResourceStream(fileName);
        List<string> lines = new List<string>();
        List<Model> collection = new List<Model>();
        if (inputStream != null)
        {
            string line;
            StreamReader reader = new StreamReader(inputStream);
            while ((line = reader.ReadLine()) != null)
            {
                lines.Add(line);
            }
            lines.RemoveAt(0);

            foreach (var dataPoint in lines)
            {
                string[] data = dataPoint.Split(',');

                collection.Add(new Model(data[0], Convert.ToDouble(data[1])*100, Convert.ToDouble(data[2])*100,Convert.ToDouble(data[3]) * 100,
                    Convert.ToDouble(data[4]) * 100, Convert.ToDouble(data[5]) * 100, Convert.ToDouble(data[6]) * 100));
            }

        }

        return collection;
    }
}
Step 3: Configuring the Syncfusion WPF Charts control
Next, let’s configure the Syncfusion WPF Charts control using this documentation.
<chart:SfChart>
 <chart:SfChart.PrimaryAxis>
  <chart:CategoryAxis/>
 </chart:SfChart.PrimaryAxis>

 <chart:SfChart.SecondaryAxis>
  <chart:NumericalAxis/>
 </chart:SfChart.SecondaryAxis>
</chart:SfChart>
Step 4: Binding the data to the WPF stacked bar chart
We’ll use the Syncfusion WPF StackingBarSeries to display detailed information about the percentage of teens visiting social media apps in the U.S.
In this example, we need six stacked bar series to analyze the different categories of usage. The Syncfusion WPF Charts control provides a way to arrange multiple series inside the same chart area.
Refer to the following code example.
<chart:StackingBarSeries ItemsSource="{Binding Collection}" XBindingPath="Category" YBindingPath="AlmostConstantly" >
</chart:StackingBarSeries>

<chart:StackingBarSeries ItemsSource="{Binding Collection}" XBindingPath="Category" YBindingPath="SeveralTimesADay" >
</chart:StackingBarSeries>

<chart:StackingBarSeries ItemsSource="{Binding Collection}" XBindingPath="Category" YBindingPath="AboutOnceADay" >
</chart:StackingBarSeries>

<chart:StackingBarSeries ItemsSource="{Binding Collection}" XBindingPath="Category" YBindingPath="SeveralTimesAWeek" >
</chart:StackingBarSeries>

<chart:StackingBarSeries ItemsSource="{Binding Collection}" XBindingPath="Category" YBindingPath="LessOften" >
</chart:StackingBarSeries>

<chart:StackingBarSeries ItemsSource="{Binding Collection}" XBindingPath="Category" YBindingPath="DoNotUse">
</chart:StackingBarSeries>
In the code example, the ItemSource property is bound with the Collection property. The XBindingPath property is bound with the Category property. The YBindingPath is bound with the respective category of usage.
Step 5: Customizing the chart appearance
Let’s see how to customize the WPF stacked bar chart’s appearance to enhance the readability of the data.
Adding the chart title
We can improve the readability of the plotted data by including a title in the chart, as shown in the following code example.
<chart:SfChart.Header>
 <Border BorderBrush="White" Margin="0, 0, 0, 10">
  <StackPanel Orientation="Horizontal">
   <Grid Width="10" Background="#2C8CEE" Margin="0, 8, 0, 5"/>
   <StackPanel>
    <TextBlock FontSize="18" Margin="5" Text="Teenage Digital Engagement in the US 2023"/>
    <TextBlock FontSize="13" Margin="5" Text="% of U.S. teens age 13 to 17 who report visiting or using the following apps or sites ..."/>
   </StackPanel>
  </StackPanel>
 </Border>
</chart:SfChart.Header>
Customizing the axis
Let’s customize the primary and secondary axes using the following properties:
- FontSize: To change the axis label font size as desired.
- ShowGridLines: To customize the visibility of gridlines.
- LabelPlacement: To position the labels.
- Visibility: To update the visibility of the axis line.
Refer to the following code example.
<chart:SfChart.PrimaryAxis>
 <chart:CategoryAxis  ShowGridLines="False" LabelPlacement="BetweenTicks" FontSize="13" TickLineSize="0" IsInversed="True" >
 </chart:CategoryAxis>
</chart:SfChart.PrimaryAxis>

<chart:SfChart.SecondaryAxis>
 <chart:NumericalAxis ShowGridLines="False" Visibility="Collapsed" >
 </chart:NumericalAxis>
</chart:SfChart.SecondaryAxis>
Series customization
Refer to the following code example to set the fill colors for the StackingBarSeries using the Interior property.
<chart:StackingBarSeries Interior="#002748" ItemsSource="{Binding Collection}" XBindingPath="Category" YBindingPath="AlmostConstantly" >
</chart:StackingBarSeries>
Step 6: Adding interactivity support
Finally, add the tooltip feature, which enhances interactivity by allowing you to track a data point with the cursor closely.
<DataTemplate x:Key="tooltipTemplate">
 <StackPanel  Orientation="Horizontal">
  <TextBlock Text="{Binding Series.Label}" Foreground="White" FontWeight="Medium" FontSize="12" HorizontalAlignment="Center" VerticalAlignment="Center"/>
  <TextBlock Text=" : " Foreground="White" FontWeight="Medium" FontSize="12" HorizontalAlignment="Center" VerticalAlignment="Center"/>
  <TextBlock Text="{Binding YData,StringFormat='###'}" Foreground="White" FontWeight="Medium" FontSize="12" HorizontalAlignment="Center" VerticalAlignment="Center"/>
 </StackPanel>
</DataTemplate>

<chart:StackingBarSeries TooltipTemplate="{StaticResource tooltipTemplate}" ShowTooltip="True" Interior="#002748" ItemsSource="{Binding Collection}" XBindingPath="Category" YBindingPath="AlmostConstantly" >
</chart:StackingBarSeries>
After executing the previous code examples, we’ll get output like in the following image.

GitHub reference
For more details, refer to the demo on GitHub.
Conclusion
Thank you for reading! Amid growing concerns about social media’s impact on teens, our WPF stacked bar chart unveils trends in their online engagement.
Join us for more insights in our weekly chart blogs, fueling constructive dialogue. Need assistance? Reach out via our support forum, support portal, or feedback portal. We’re here to assist you!


 No spam, just valuable updates.