
 Lokesh Arjunan
TL;DR: Which React Gantt chart handles large schedules better? We benchmarked Syncfusion React Gantt, Bryntum Gantt, and DHTMLX Gantt across rendering, task operations, hierarchy changes, and dependency recalculation. Syncfusion performed best in most tested scenarios, completing the 100,000-task stress test in 44.4 seconds, compared with 122.2 seconds for DHTMLX. DHTMLX was faster at deletes, while Bryntum had no reported result for the 100K test. Results may vary with your data and environment.
Choosing a React Gantt chart isn’t just about features; performance matters, too. When task counts reach tens of thousands, does the chart still load quickly, respond to updates, and recalculate dependencies efficiently?
To find out how they compare, we benchmarked Syncfusion® React Gantt Chart, Bryntum Gantt, and DHTMLX Gantt with workloads of up to 100,000 tasks. All three libraries were tested using the same datasets, interactions, and environment, and the results and test resources were shared for independent verification.
What does the benchmark measure?
The benchmark focuses on client-side React performance across five areas:
- Initial rendering
- CRUD operations
- Hierarchical expand/collapse actions
- Dependency recalculation
- Large-scale stress workloads
The benchmark does not evaluate feature depth, licensing, accessibility, exporting, collaboration features, or memory consumption.
All tests used production builds, the same machine and browser, and the same logical datasets, with only the data-format adaptations required by each library’s API.
Because Syncfusion conducted this benchmark, the results should be considered a reproducible data point rather than a definitive industry ranking. Independent validation is encouraged.
Test environment
To compare the three libraries under consistent conditions, we used the following hardware and software configuration.
| Item | Configuration |
| Operating System | Windows 11 Enterprise |
| Processor | Intel(R) Core(TM) i5-10210U CPU @ 1.60GHz |
| Memory | 16 GB RAM |
| Browser | Microsoft Edge Version 154.0.4258.62 (Official build) (64-bit) |
| Node.js | v24.19.0 |
| React | 19.2.8 |
| Build Tool | Create React App (CRA) |
React Gantt library versions
The benchmark used the following versions:
| Library | Version |
| Syncfusion React Gantt Chart | 35.1.37 |
| Bryntum Gantt | 7.3.5 |
| DHTMLX Gantt | 10.0.2 |
Performance can vary between releases, so these versions define the scope of this comparison.
Build and runtime conditions
Benchmark results can be influenced by factors beyond the Gantt component itself. To reduce avoidable variance and provide a fair comparison, all runs were executed under the same baseline conditions:
- Production builds only, without development-mode measurements.
- Local execution on the same machine.
- Browser extensions disabled.
- No intentionally parallel workloads during benchmark capture.
- Identical logical datasets, with only the minimum data-format adaptations required by each library.
- Consistent benchmark workflows, measurement logic, and runtime configuration across test scenarios.
The benchmark repository is available on GitHub: Gantt Chart Performance Benchmark Repository
The repository is intended to provide the dataset generators, configuration files, benchmark scripts, and raw measurements in CSV and JSON formats. These resources allow readers to inspect the results, verify calculations, and reproduce the tests in their own environments.
Readers are encouraged to run the workloads using their own hardware, browser versions, and project configurations to assess how the results relate to their applications.
Dataset design
The benchmark uses synthetic datasets rather than real project files. This approach allows the same workload characteristics to be applied consistently across the three libraries, although the datasets cannot represent every project structure or scheduling pattern.
The scenarios cover 5,000 to 100,000 tasks and include:
- Repeated parent-child structures for rendering tests.
- Deep hierarchies with 10 levels of nesting for navigation tests.
- Dependency-heavy schedules for recalculation tests.
- Combined hierarchy and scale workloads for stress testing.
The dataset generators are included in the benchmark repository so that readers can recreate the same scenarios and validate the results in different environments.
What we observed
Initial rendering
The largest gap appeared during initial load.
| Tasks | Syncfusion | Bryntum | DHTMLX |
| 5K | 1.5 s | 8.3 s | 1.5 s |
| 10K | 2.1 s | 18.4 s | 3.3 s |
| 25K | 5.1 s | 52.5 s | 11.1 s |
| 50K | 10.2 s | 91.2 s | 54.2 s |
At smaller sizes, Syncfusion and DHTMLX produced similar results, while Bryntum required noticeably more time to complete rendering. As dataset size increased, the gap widened significantly.
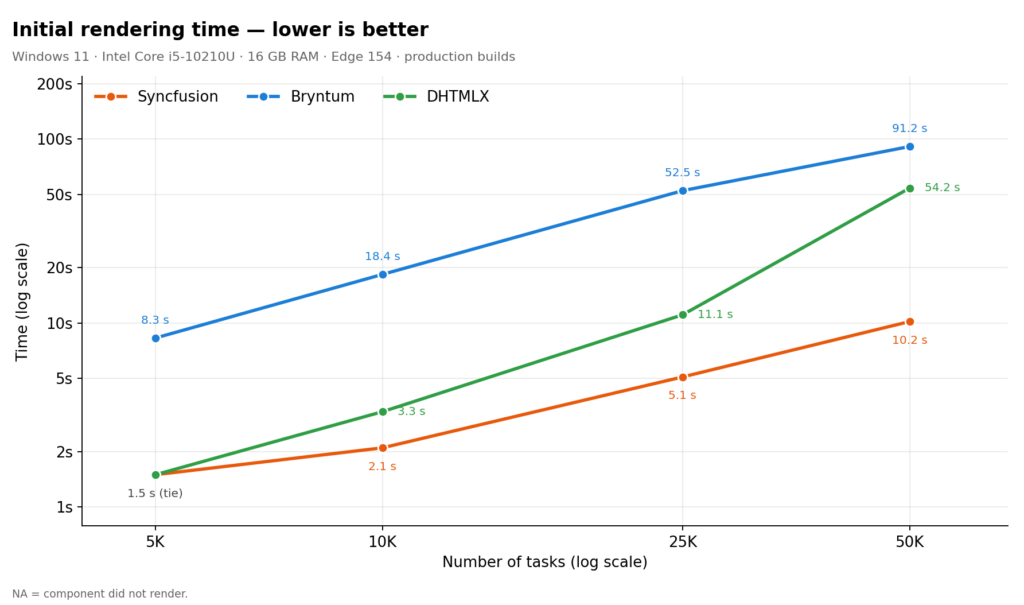
The most interesting observation is not the absolute numbers but the scaling behavior. Between 5K and 50K tasks, Syncfusion’s growth curve remained comparatively gradual, while DHTMLX and Bryntum increased more sharply.
For teams routinely opening 25K-50K task portfolios, this difference could affect perceived application responsiveness.
Note: The page load timer starts when the dataset is assigned to the Gantt Chart. The timer stops in the dataBound event after the Gantt Chart has completed rendering, and the elapsed time is displayed as the initial rendering time.
Editing performance
For interactive planning applications, editing performance can be just as important as initial rendering.
Record updates were generally the fastest operation across all libraries:
| Dataset | Syncfusion | Bryntum | DHTMLX |
|---|---|---|---|
| 5K | 9.8 ms | 30.20 ms | 16.9 ms |
| 10K | 11.7 ms | 40.8 ms | 22.1 ms |
| 25K | 17.2 ms | 44.8 ms | 76.0 ms |
| 50K | 21.2 ms | 64.5 ms | 147.8 ms |
Syncfusion and DHTMLX consistently completed updates in milliseconds, while Bryntum showed higher variability across the reported scenarios.
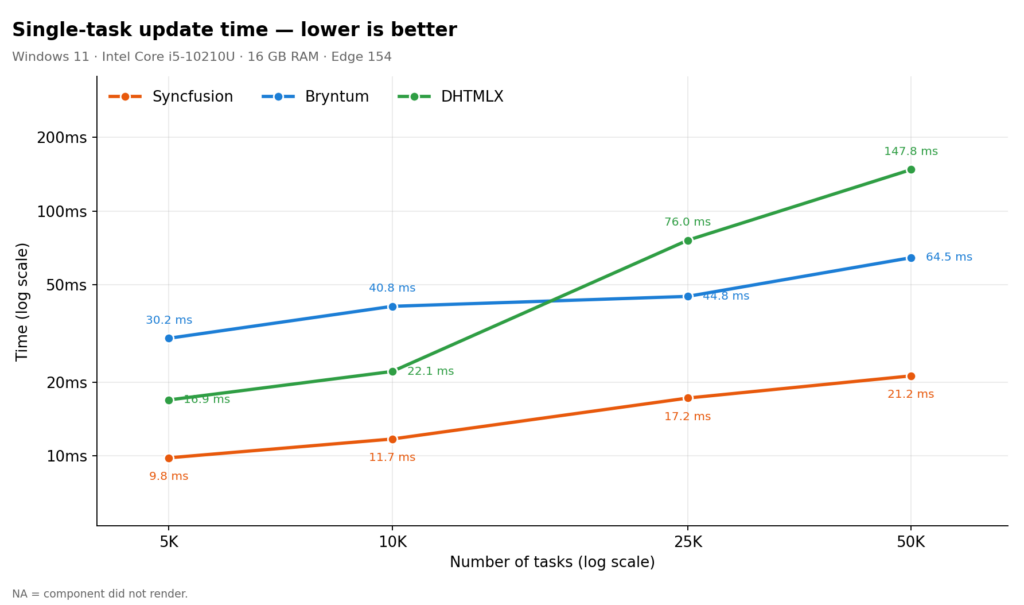
Note: A record update represents the benchmark’s defined update operation applied to a single task. See the benchmark repository for the exact implementation and measurement logic.
The practical distinction here is substantial. A sub-25 ms update feels instantaneous. Multi-second delays are immediately visible to users and can interrupt planning workflows.
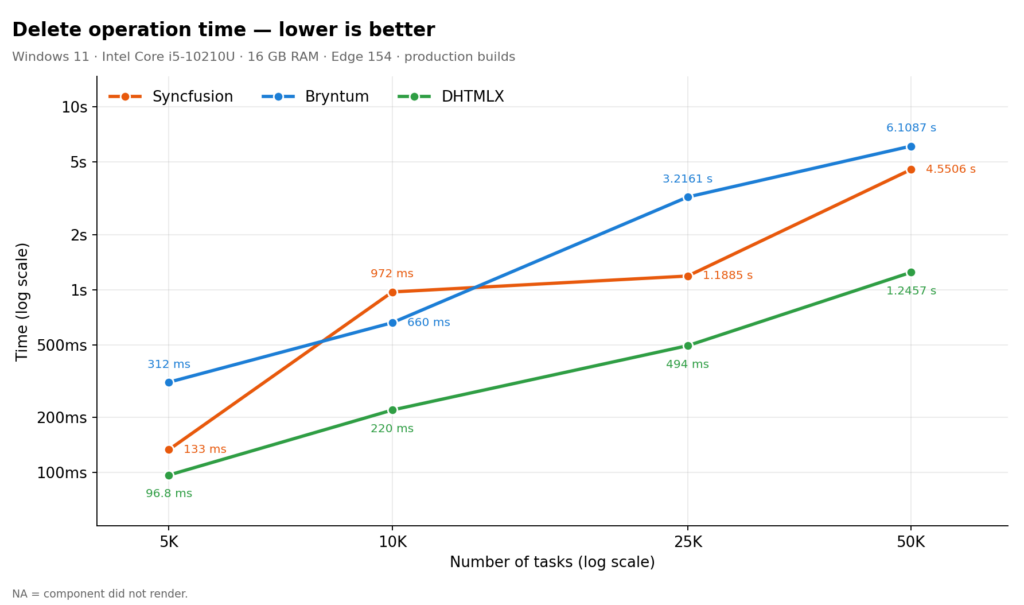
Delete operations proved significantly more expensive for every library, especially at larger scales. Even the fastest measurements exceeded one second at 50K records, highlighting that large hierarchical removals remain a costly operation regardless of implementation.
| Dataset | Syncfusion | Bryntum | DHTMLX |
| 5K Tasks | 133.3 ms | 311.9 ms | 96.8 ms |
| 10K Tasks | 972.1 ms | 660.3 ms | 219.6 ms |
| 25K Tasks | 1,188.5 ms | 3,216.1 ms | 494.2 ms |
| 50K Tasks | 4,550.6 ms | 6,108.7 ms | 1,245.7 ms |
Deep hierarchies
Large project schedules can contain nested work breakdown structures rather than flat task lists. To measure hierarchy operations, the benchmark tested expanding and collapsing all tasks across 10 levels of nesting.
At 50K tasks:
| Operation | Syncfusion | Bryntum | DHTMLX |
| Expand all | 69.6 ms | 6485.7 ms | 500.7 ms |
| Collapse all | 43.9 ms | 3592.6 ms | 196.1 ms |
The benchmark showed a substantial difference between the three implementations. Syncfusion and DHTMLX remained relatively responsive, while Bryntum required multiple seconds to complete bulk hierarchy actions in this benchmark configuration.
Dependency recalculation
Dependency processing was the most computationally expensive workload.
Even the best-performing measurements became substantial at larger sizes.
| Tasks | Syncfusion | Bryntum | DHTMLX |
| 25K | 15.9 s | 62.2 s | 20.6 s |
| 50K | 47.5 s | NA | 84.7 s |
Note: NA (Not Available) indicates that the scenario could not be completed successfully due to excessive execution time or application instability.
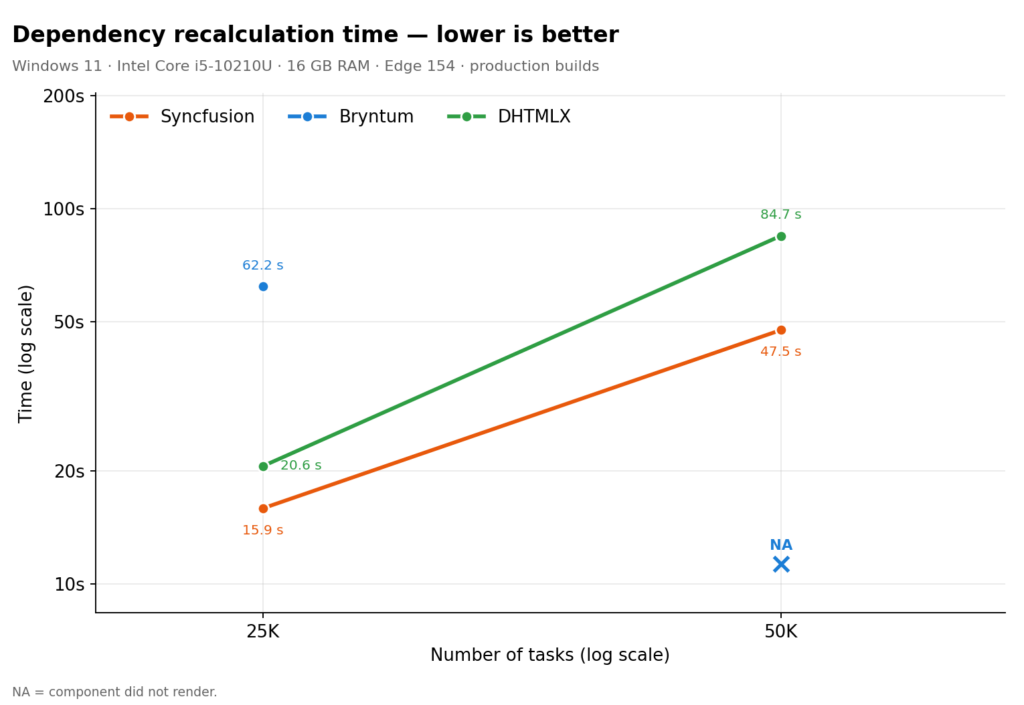
These results reinforce an important lesson: large dependency networks are expensive regardless of vendor.
Teams building dependency-heavy planning systems should benchmark their own scheduling topology before committing to a component. The synthetic chains used in this benchmark help provide consistency, but they cannot represent every real-world project structure.
Note: These tests used the dependency structure generated by the benchmark dataset. Because dependency topology can vary substantially between projects, these results should be treated as workload-specific rather than universal performance limits.
How the Gantt libraries handle 100,000 tasks
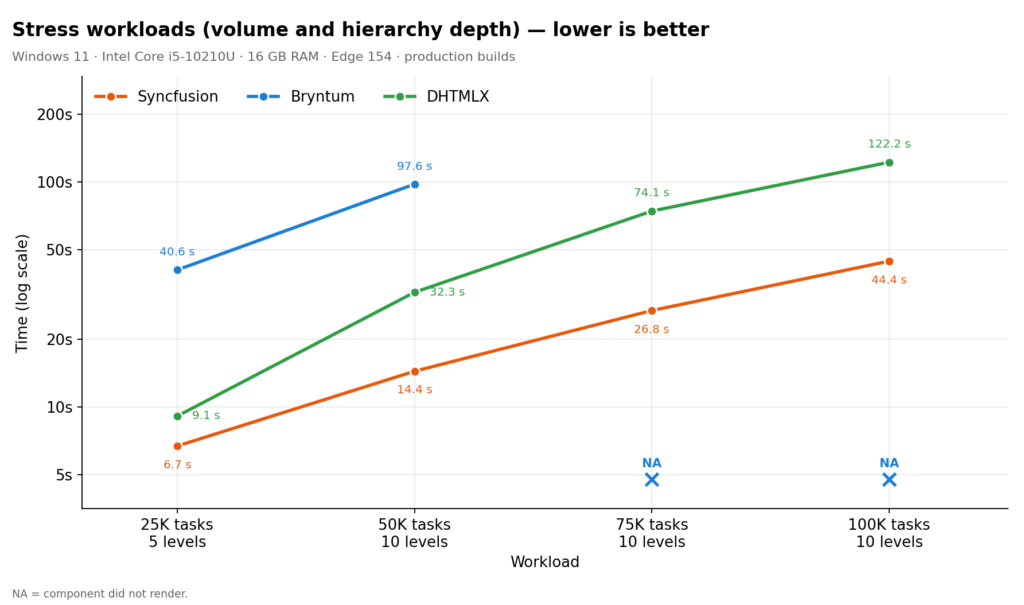
The final scenario combined volume and hierarchy depth.
| Workload | Syncfusion | Bryntum | DHTMLX |
| 25K / 5 levels | 6.7 s | 40.6 s | 9.1 s |
| 50K / 10 levels | 14.4 s | 97.6 s | 32.3 s |
| 75K / 10 levels | 26.8 s | NA | 74.1 s |
| 100K / 10 levels | 44.4 s | NA | 122.2 s |
In this benchmark environment, Syncfusion completed the 100,000-task workload in 44.4 seconds, while DHTMLX required 122.2 seconds. Bryntum did not complete the largest reported scenarios
What developers should take away?
The key takeaway is that Gantt performance depends on the workload:
- Large schedules: Focus on initial rendering time.
- Frequent task edits: Compare update and delete latency.
- Dependency-heavy projects: Pay closer attention to recalculation performance than rendering alone.
- Projects with more than 50,000 tasks: Test with your own data rather than relying on benchmark results alone.
Benchmark summary (all times in seconds)
| Scenario | Syncfusion | Bryntum | DHTMLX |
|---|---|---|---|
| Initial rendering (50K tasks) | 10.2 | 91.2 | 54.2 |
| Record update (50K tasks) | 0.021 | 3.0 | 0.148 |
| Delete (50K tasks) | 4.551 | 6.109 | 1.246 |
| Expand all (50K tasks) | 0.070 | 6.486 | 0.501 |
| Collapse all (50K tasks) | 0.044 | 3.593 | 0.196 |
| Dependency recalculation (50K tasks) | 47.5 | NA | 84.7 |
| Stress test (100K tasks, 10 levels) | 44.4 | NA | 122.2 |
| Scrolling (FPS) | Not compared | 60 | 60 |
Key takeaway: Syncfusion recorded the lowest times in five of the six scenarios compared, with DHTMLX fastest for deletes. Bryntum did not render the 50K dependency recalculation or the 75K and 100K stress workloads. Results reflect synthetic data in one test environment, so validate them against your own workload.
Conclusion
A Gantt chart that performs well with a small dataset can behave very differently when it manages thousands of tasks and dependencies. Testing against your own workload matters as much as reading benchmark results.
Syncfusion ran this benchmark to show how Syncfusion React Gantt Chart, Bryntum Gantt, and DHTMLX Gantt handle demanding scheduling operations. The results reflect one test environment and dataset structure, so use them as a starting point and rerun the tests on your own hardware and data.
Ready to evaluate Syncfusion React Gantt Chart? Explore the live demos, read the documentation, or start a free trial to test it with your own schedules.
For existing Syncfusion customers, the latest version of Essential Studio is available from the License and Downloads page. New users can explore its capabilities through the 30-day free trial.
If you have questions or feedback, reach out through our support forum, support portal, or feedback portal.



 No spam, just valuable updates.