

TL;DR: Tired of inefficient coding cycles in project management tools? Integrating a React Gantt Chart into Framer streamlines setup, delivers structured files, and enables task-driven execution, all directly on the canvas. With Framer’s developer mode and Gantt integration, you achieve an efficient workflow that keeps project timelines precise. The result is fewer errors, faster previews, neater layouts, and scalable visualizations for your team.
The Syncfusion® React Gantt Chart is a robust tool for project planning and tracking. It provides an interactive timeline to manage tasks, dependencies, and resources with built-in editing and drag-and-drop. Using it in Framer’s design and prototyping platform allows developers and designers to build interactive, data-driven project management UIs.
This blog walks through a step-by-step approach to integrating the Syncfusion React Gantt Chart into a Framer project, including a practical, working code example to help you get started quickly.
Why integrate Syncfusion React Gantt Chart with Framer?
Framer’s developer mode supports React-based components, making it an ideal platform for embedding Syncfusion’s feature-rich Gantt Chart. This integration is perfect for prototyping complex project timelines interactively, bridging the gap between design and development.
Key benefits:
- Dynamic visualizations: Display tasks, dependencies, and milestones with Syncfusion’s customizable Gantt Chart.
- Interactive prototyping: Leverage Framer’s design environment to create user-friendly interfaces.
- Seamless integration: Combine Syncfusion’s robust functionality with Framer’s flexible canvas.
Create interactive project timelines with Syncfusion React Gantt Chart. Manage tasks, dependencies, resources, milestones, and progress in a clear timeline-based project planning view.
Plan with React GanttPrerequisites
Before starting, ensure you have:
- A valid Syncfusion license key.
- Framer desktop application installed.
- Basic knowledge of React, TypeScript, and Framer’s developer mode.
Integrating Framer and Syncfusion React Gantt Chart
The first step in integrating the Syncfusion React Gantt Chart into Framer is to set up your development environment.
Framer is built for design and prototyping, while the React Gantt Chart delivers advanced project management features. Integrating both requires a few setup steps for a smooth developer workflow.
Step 1: Download and install Framer
To begin, we need to download and install the Framer desktop app for Mac or Windows. This provides the foundation for your project and for embedding custom code.
How to get started:
- Visit the Framer website to download the desktop app.
- Follow the installation instructions for your operating system.
- Once installed, open Framer and start creating a new project to integrate the Gantt Chart.
Note: Confirm you have a reliable internet connection so you can fetch dependencies and assets during setup.
Step 2: Creating the project: Set up code files in Framer
With Framer installed, the next step is to create a project and add the necessary code files to integrate the Syncfusion React Gantt Chart. This involves setting up a Gantt.tsx file for the Gantt Chart component.
Framer’s developer mode lets you add custom code files in the Assets tab, enabling seamless integration of React components.
1. Create a new project in Framer
- Open Framer and select New Project to start a fresh project.
- Name your project (e.g., “Syncfusion Gantt Integration”) and save it in your preferred location.
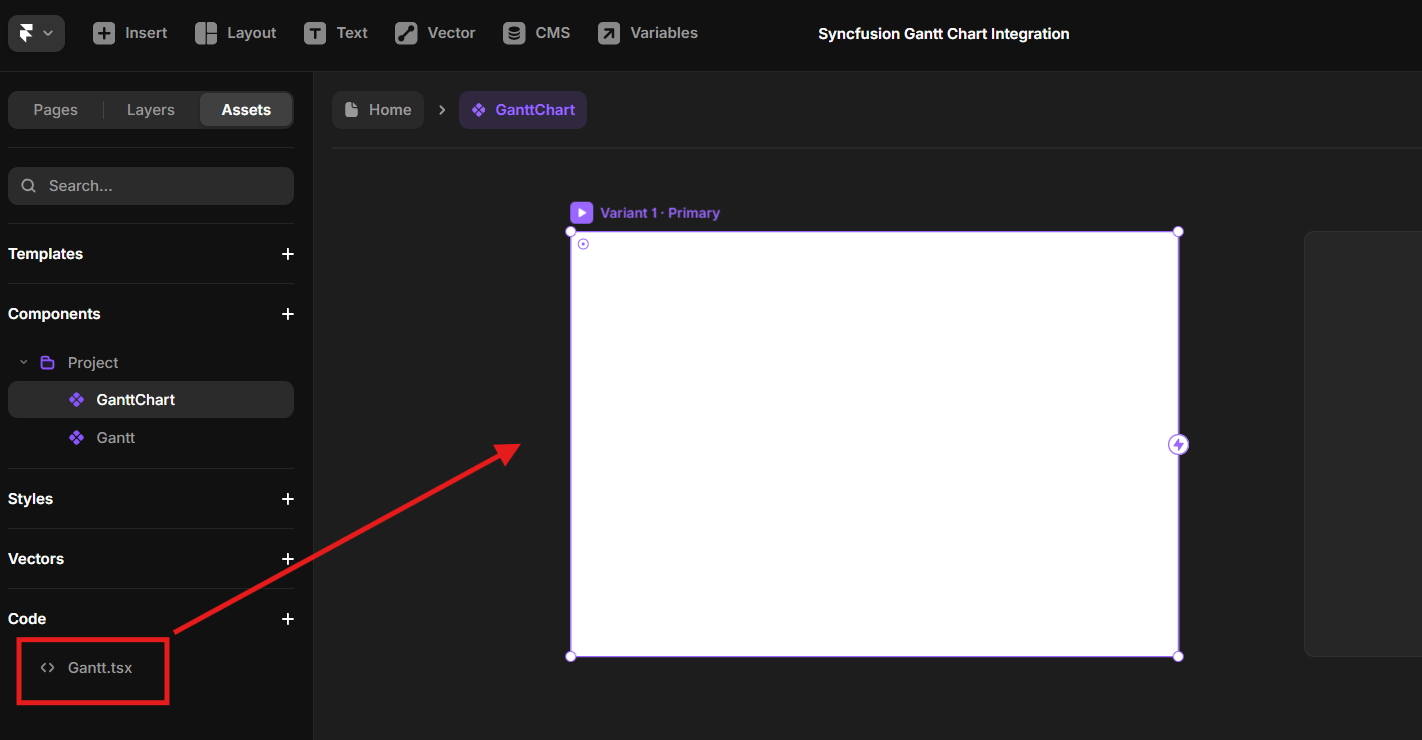
2. Add code files
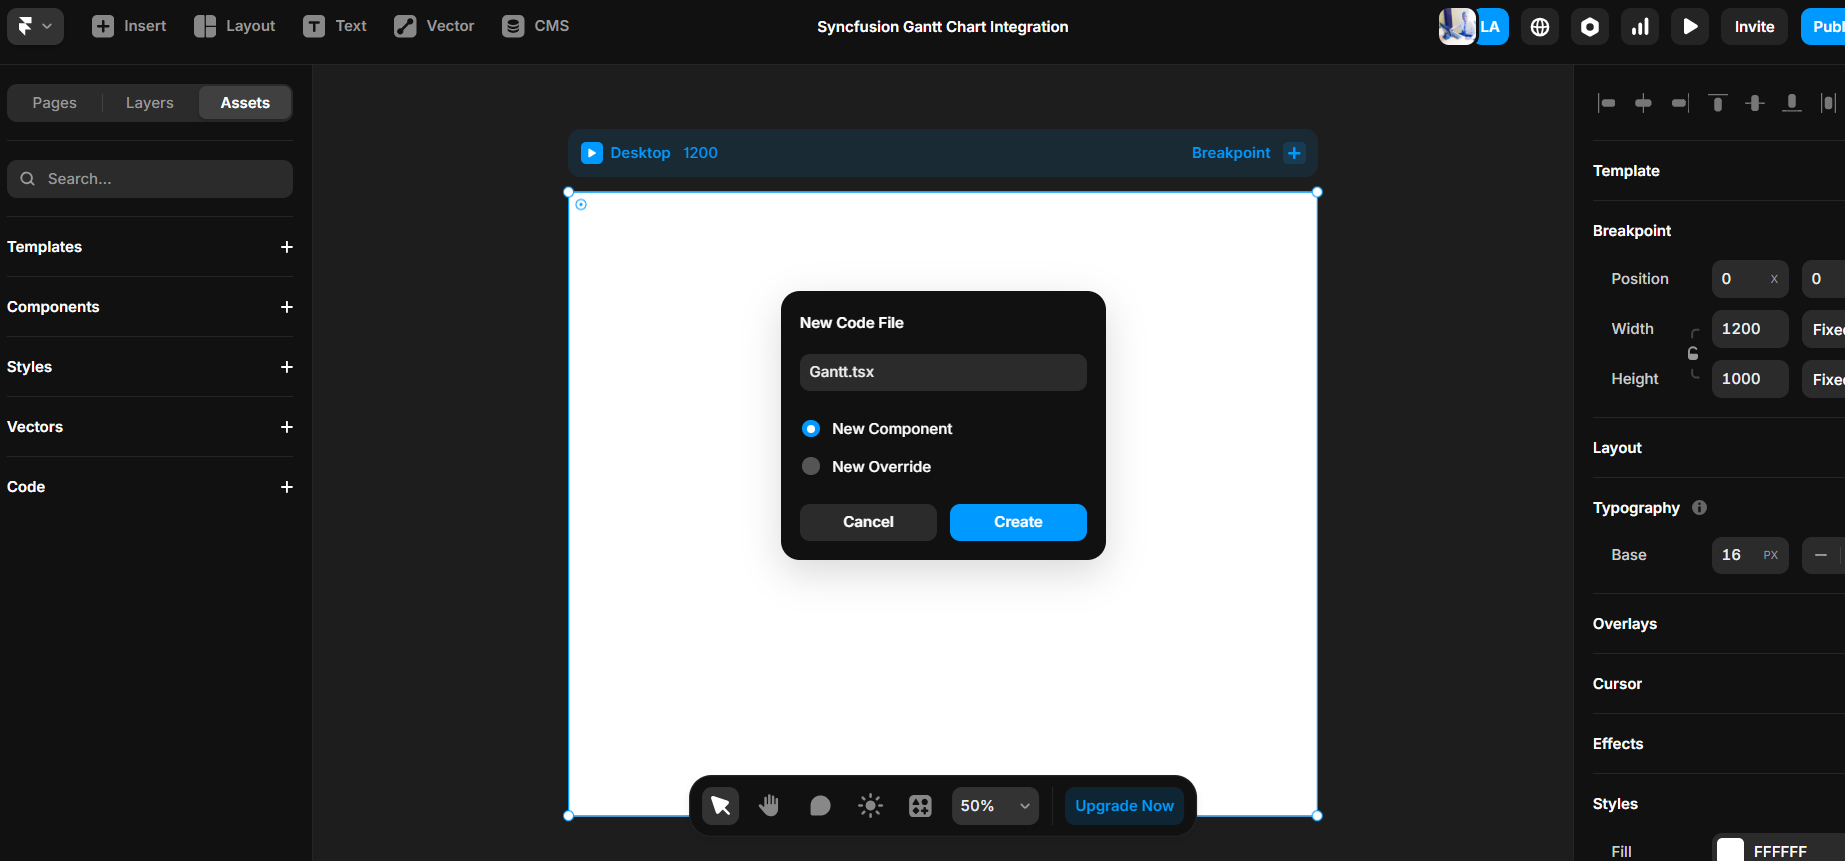
- Navigate to the Assets tab in Framer.
- Under the Code section, create a file named
Gantt.tsx.
Refer to the following image for more details.
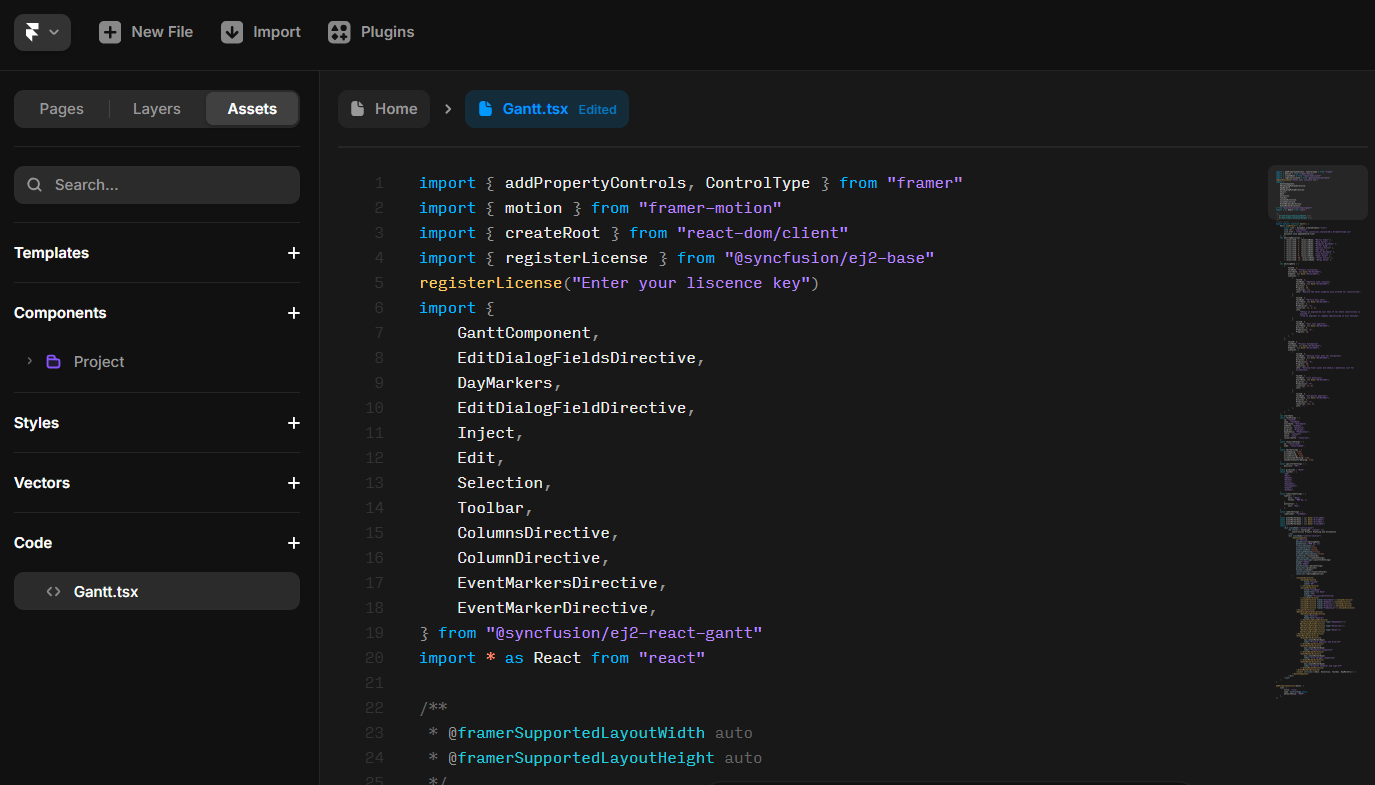
3. Configure the Gantt.tsx file
The Gantt.tsx file contains the Syncfusion React Gantt Chart, including data, styling, and configuration for tasks, resources, and timelines.
Below is the example code to configure the Gantt component in the Gantt.tsx file.
import * as React from "react";
import {
  GanttComponent,
  Inject,
  Edit,
  Selection,
  Toolbar,
  DayMarkers,
} from "@syncfusion/ej2-react-gantt";
import { registerLicense } from "@syncfusion/ej2-base";

registerLicense("YOUR_LICENSE_KEY");

const GanttChart = () => {
  return (
    <div className="control-pane">
      <div className="control-section">
        <GanttComponent
          id="Editing"
          dataSource={editingData}
          dateFormat="MMM dd, y"
          treeColumnIndex={1}
          // Add other necessary props here
        >
          <Inject services={[Edit, Selection, Toolbar, DayMarkers]} />
        </GanttComponent>
      </div>
    </div>
  );
};

export default GanttChart;
For more details, refer to the React Gantt Chart in the Framer code example.
Note: Ensure you have a valid Syncfusion license key (as shown in the registerLicense function) to use the Gantt Chart component. Replace the provided key with your own if necessary.
Step 3: Embed the Gantt Chart component
To make the Gantt Chart visible in your Framer project, you need to embed it into the Project page and update the Gantt.tsx file to render the component correctly.
To do so, please follow these steps:
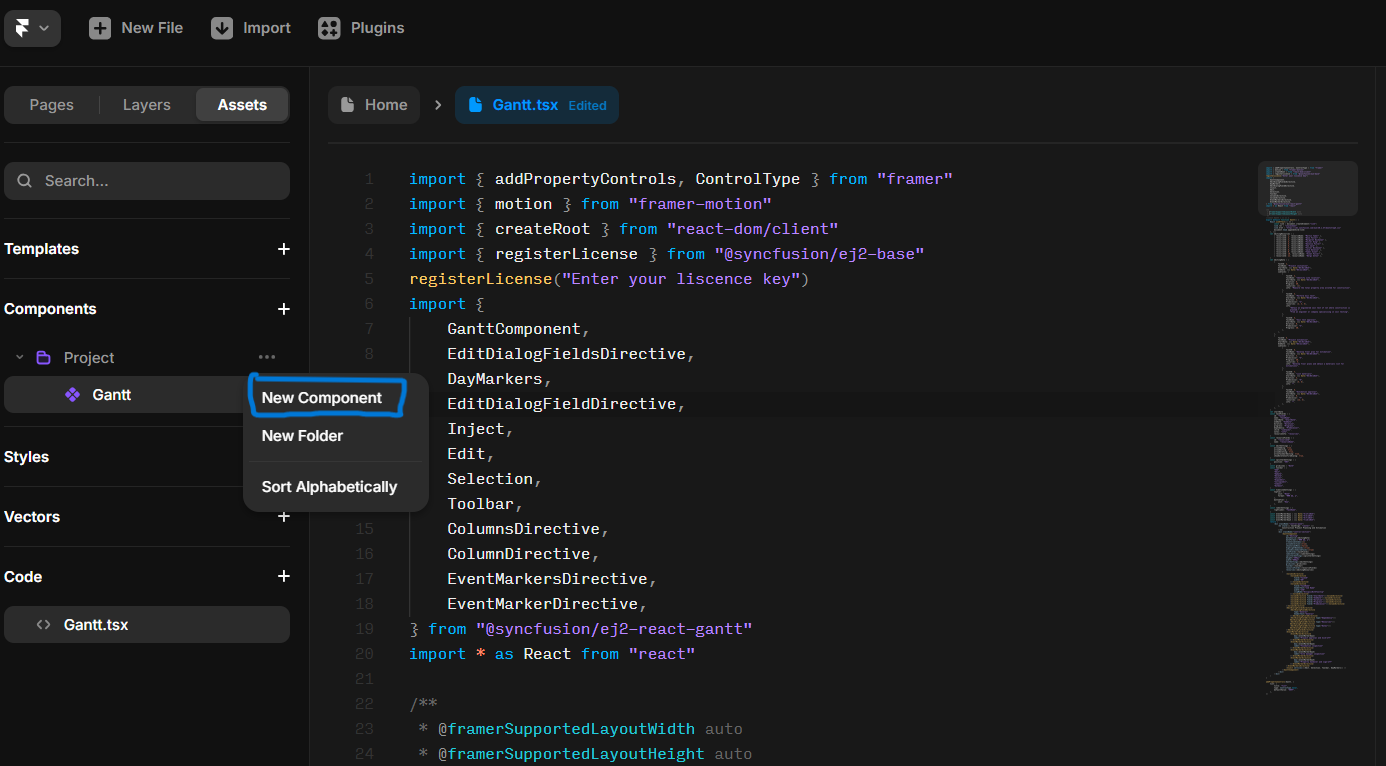
1. Create a new component in Framer
- In Framer, go to the Components section in the left panel.
- Click the “…” icon in the Project section to create a new component and name it
GanttChart.
See the images below.
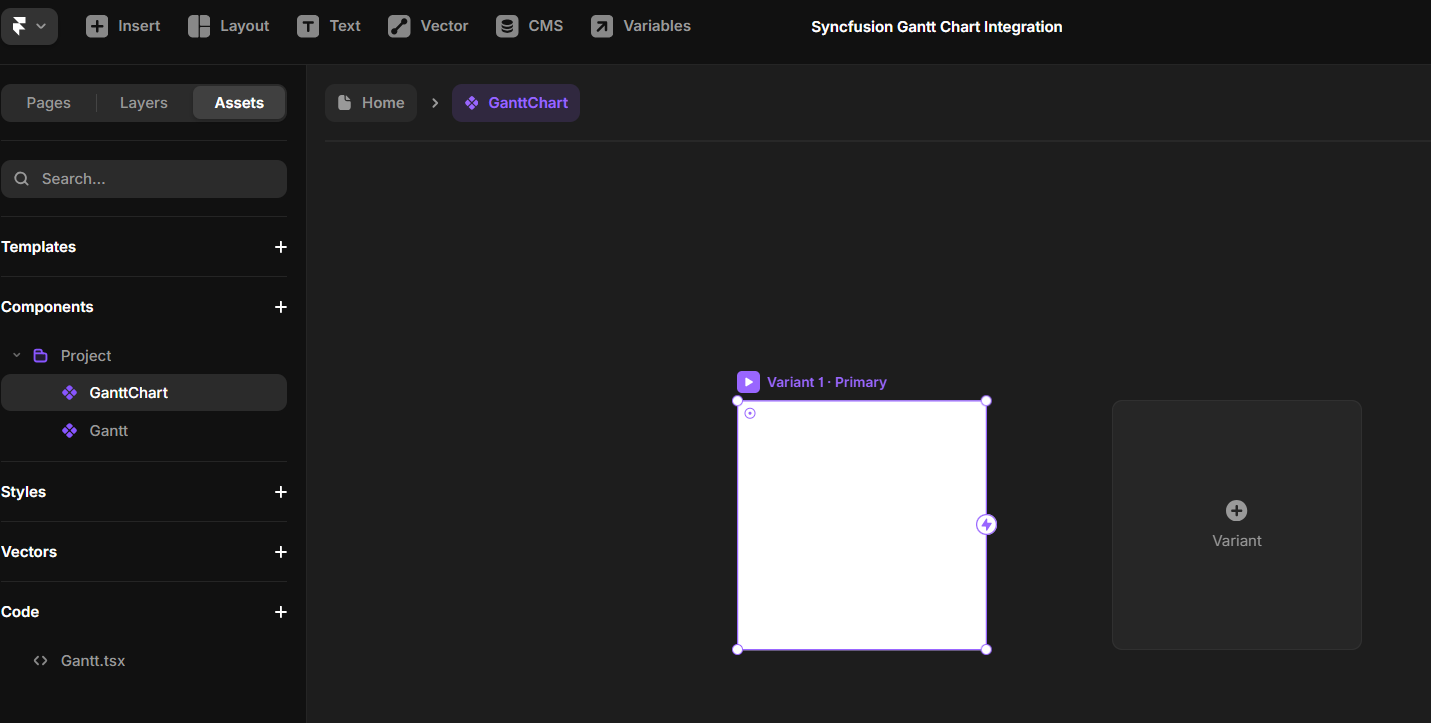
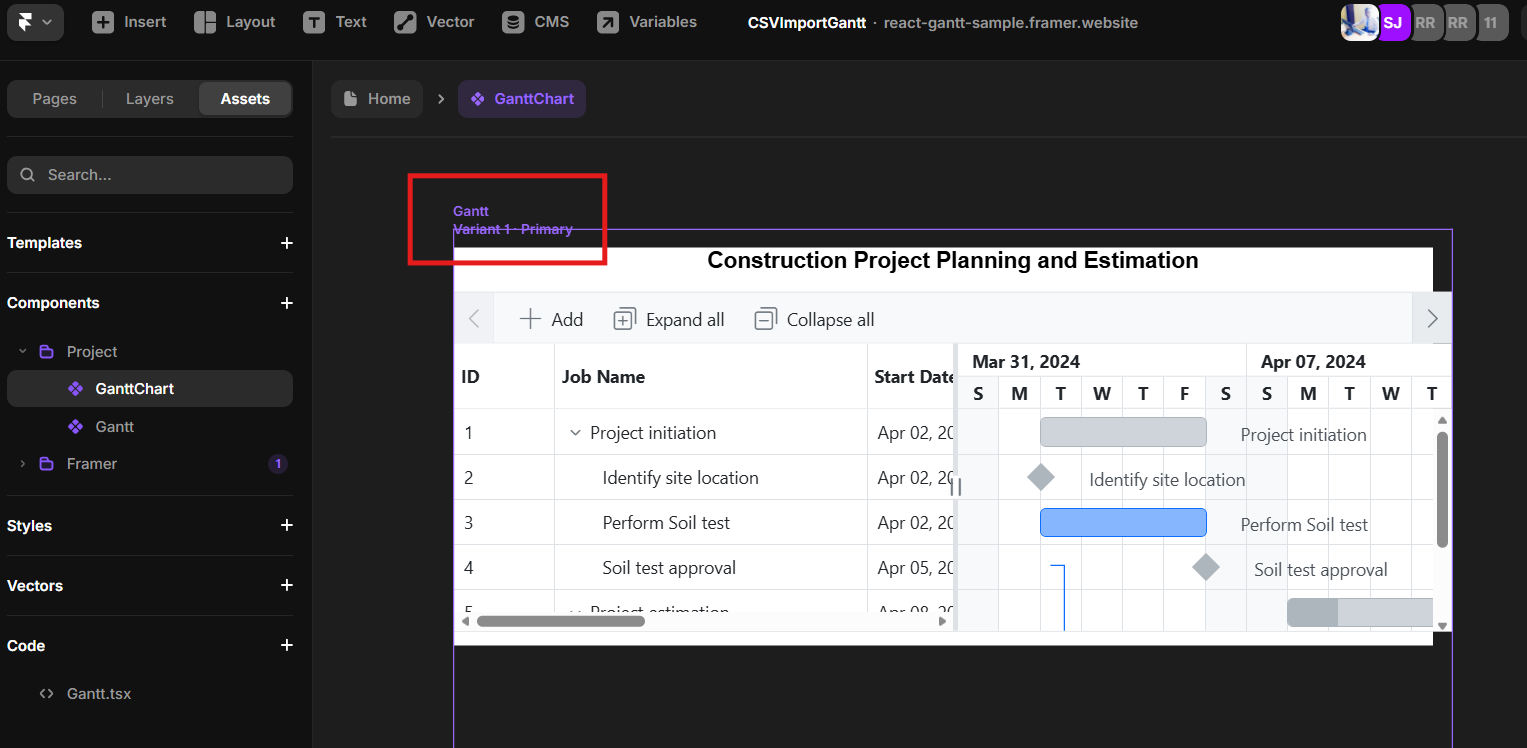
2. Import the Gantt component
- In the Framer canvas, select the
GanttChartcomponent. - In the
Assets -> Codesection, drag and drop theGantt.tsxfile onto theGanttChartcomponent in the canvas. This links the React component to the Framer project.
Here’s a preview of the feature in action:
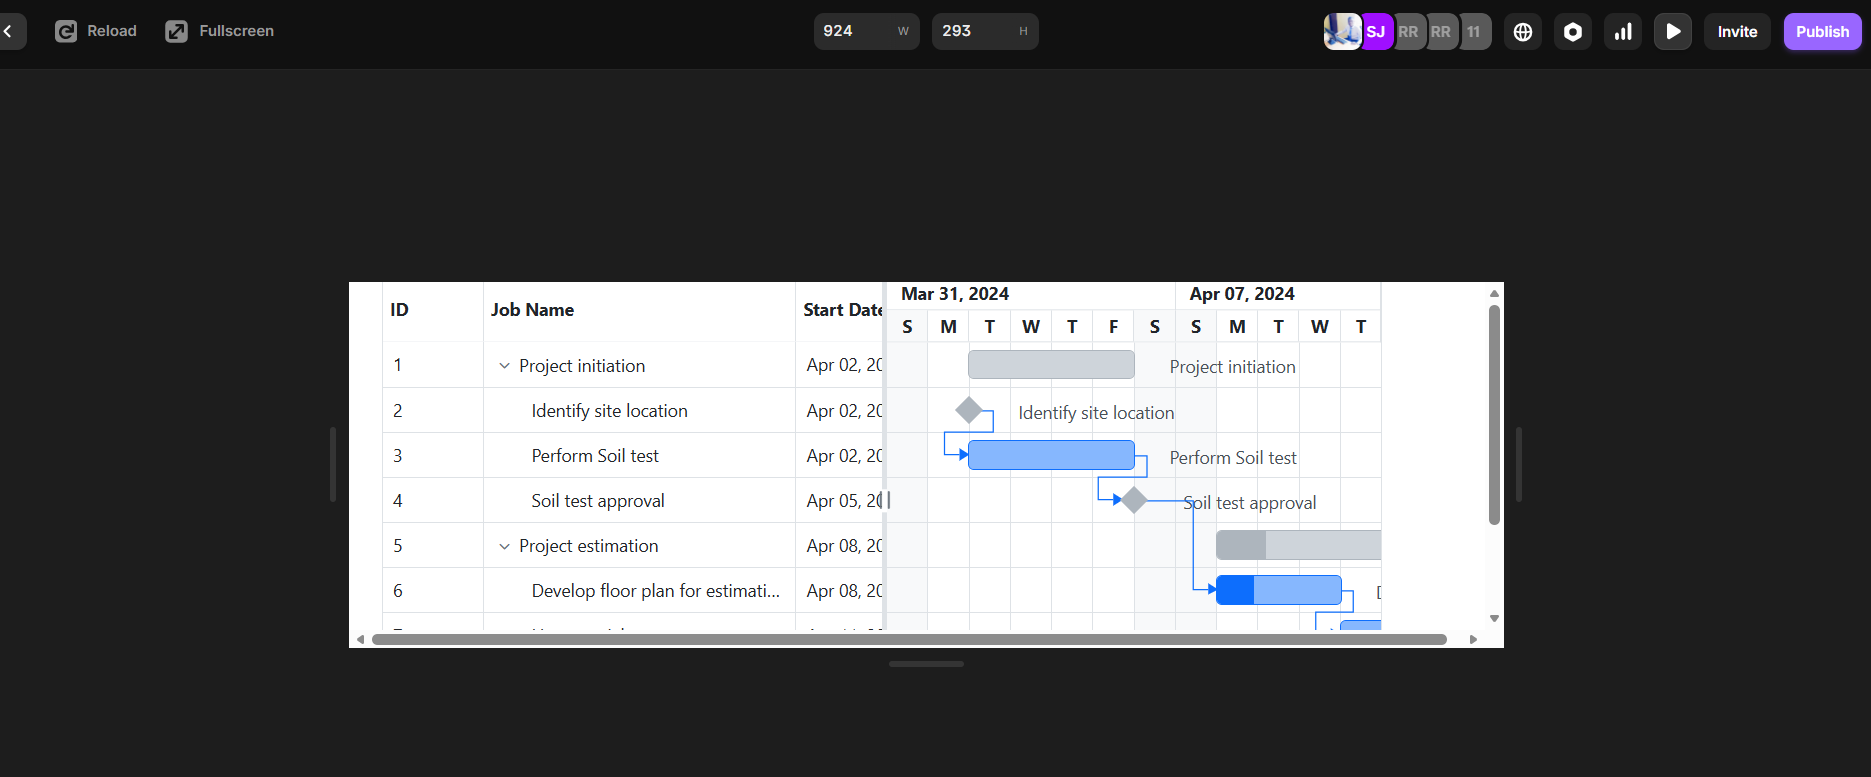
3. Preview the Gantt Chart
- Click the Play button in Framer to preview the project.
- The Syncfusion React Gantt Chart will render in the Framer canvas, displaying the project timeline with tasks, dependencies, and event markers.
Take a look at how this functionality behaves:
4. Customize the design
- You can also use Framer’s design tools to adjust the layout and styling, or add UI elements around the Gantt Chart (e.g., buttons, headers, or sidebars).
- Ensure the Gantt Chart’s width and height properties (set in
Gantt.tsxfile) fit within your Framer canvas.
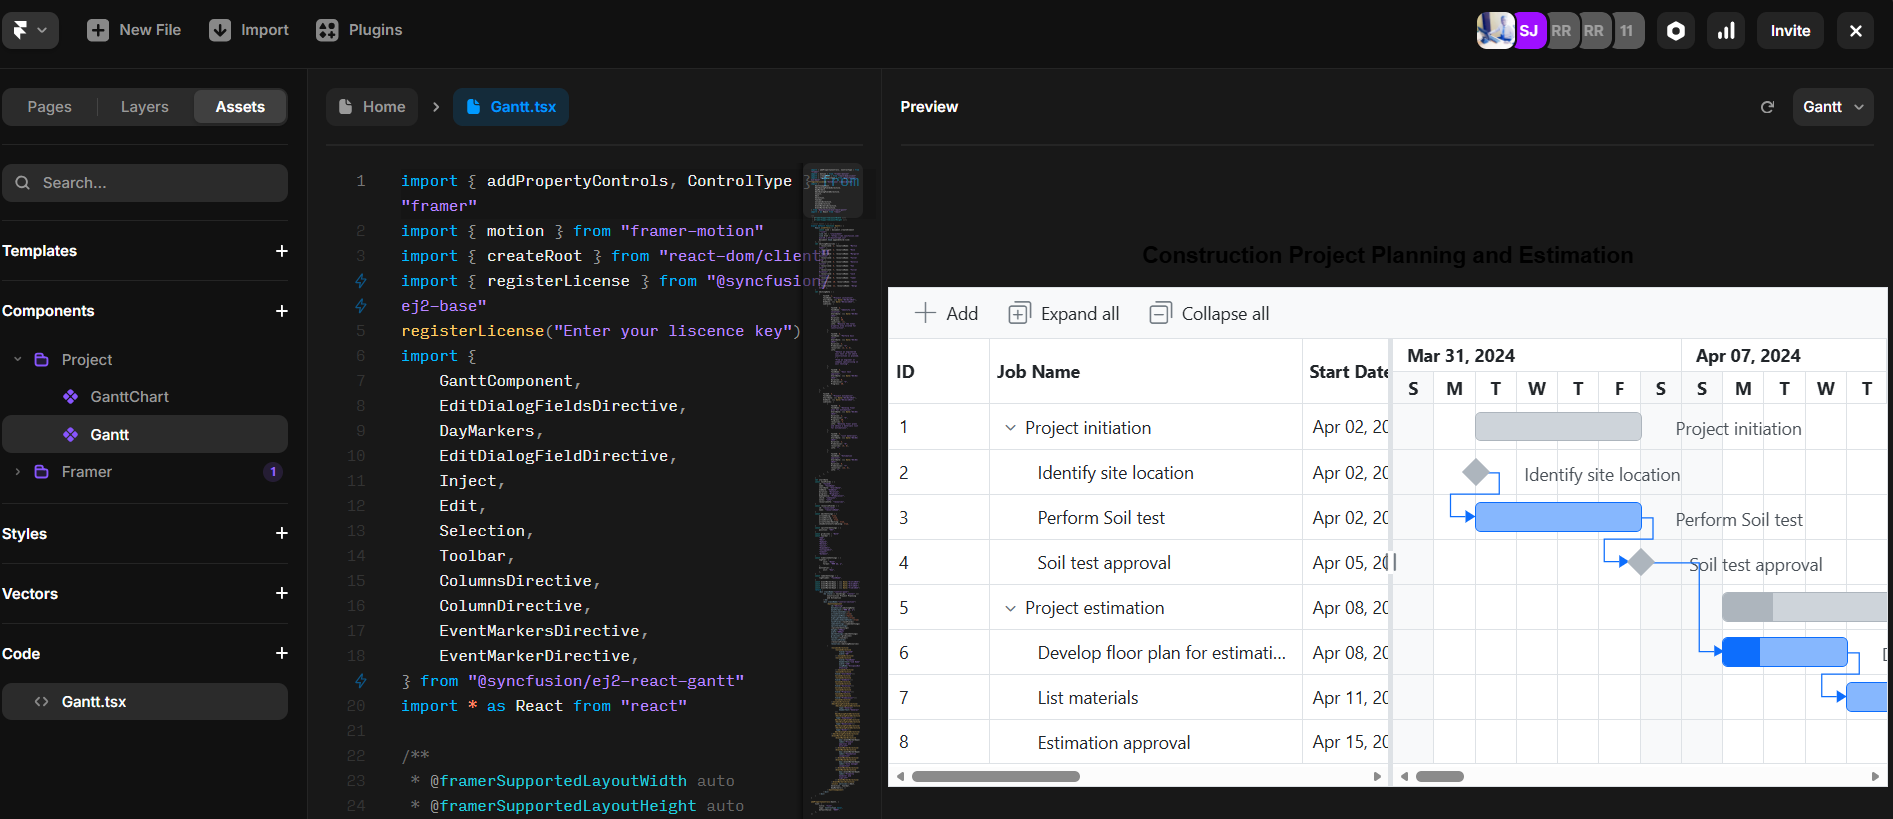
Once integrated, your Framer project will display a fully functional Syncfusion React Gantt Chart, as shown in the following image.
Frequently Asked Questions
Do I need a paid Syncfusion license to make this work?
Yes, the Syncfusion Gantt Chart requires a valid commercial license for production use (or beyond the community license limits). In the code, replace “YOUR_LICENSE_KEY” with your actual key from the Syncfusion dashboard. Without a valid key, you’ll see watermarking, feature restrictions, or runtime errors.
Can I install additional Syncfusion packages or npm dependencies in Framer?
Framer’s code environment has limitations; it doesn’t support arbitrary npm install like a normal React app. You need to use packages that are compatible with Framer’s bundler. The @syncfusion/ej2-react-gantt package usually works if imported correctly, but for extras (e.g., themes or other Syncfusion controls), test thoroughly.
How do I make the Gantt Chart responsive or fit the Framer canvas properly?
Set explicit height and width props on (e.g., height=”100%” or width=”100%”), or wrap it in a div with Framer-friendly styles. Use Framer’s layout tools (constraints, auto-layout) around the component instance. Avoid fixed pixel sizes unless necessary; percentage-based sizing usually plays better with Framer’s responsive canvas.
Why isn't the Gantt Chart rendering at all in Framer preview?
The most common reasons are a missing/invalid Syncfusion license key (check the console for license errors), incorrect imports or the @syncfusion/ej2-react-gantt package not being properly referenced, or the component not exported as default and correctly linked/dropped onto the Framer canvas. Open Framer’s preview console to spot React errors like module not found or hydration issues, and verify your setup step-by-step.

Build robust project timelines with React Gantt Chart and Framer
Thanks for reading! In this blog, we’ve explored the step-by-step process of integrating the Syncfusion React Gantt Chart into Framer. This integration empowers designers and developers to create dynamic, interactive project management visualizations within Framer’s prototyping environment. Try out these steps and share your feedback in the comments section below!
If you’re already a Syncfusion user, you can download the latest version of Essential Studio from the license and downloads page. We offer new users a 30-day free trial to explore the features and capabilities of all our components.
If you need further assistance, contact us via our support forums, support portal, or feedback portal.
We’re always here to help you!
Thank you for choosing Syncfusion!


 No spam, just valuable updates.