Skip to content
Blogs
Search blogs
Weekly Data Visualization (32)
Weekly Data Visualization
Copy RSS feed for this category
10 min read
Apr 23, 2025
Best Practices for Fonts in Blazor Charts for Better Data Visualization
Gowrimathi S
12 min read
Apr 23, 2025
Pie Chart Best Practices: How to Visualize Data Effectively
Ilamathi Govindaraj
7 min read
Feb 11, 2025
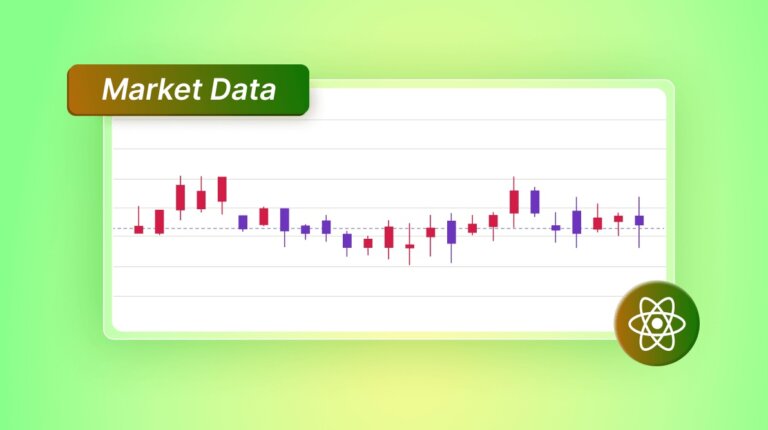
Stock Price Simulation: Visualize Real-Time Market Data Using React Candle Chart
Swetha Babu
7 min read
Feb 10, 2025
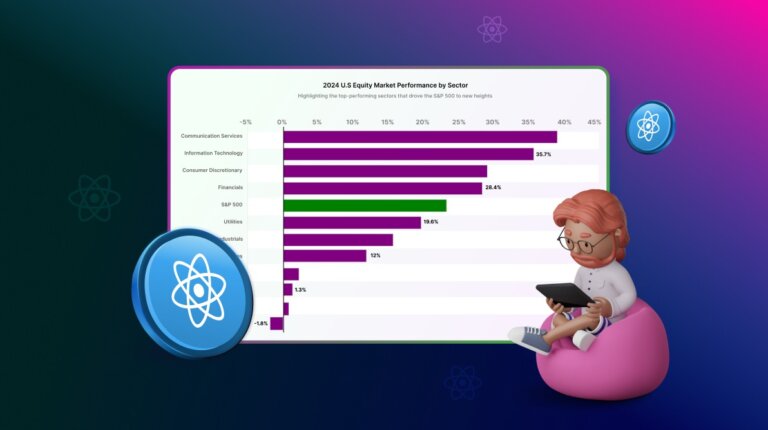
Visualizing 2024 US Stock Market Growth and Challenges with React Bar Chart
Swetha Babu
7 min read
Feb 10, 2025
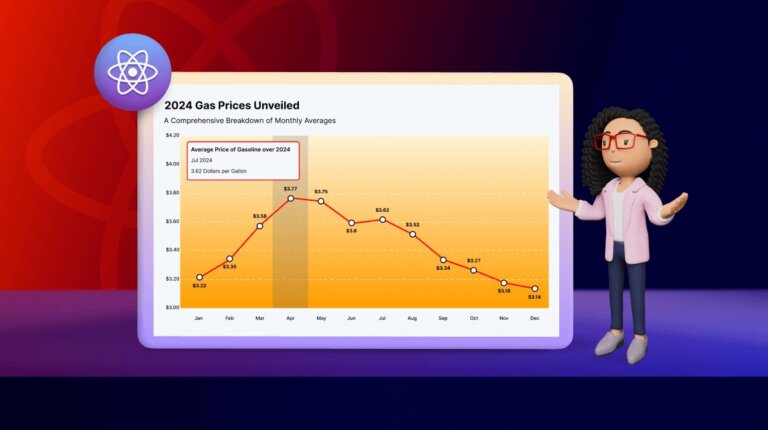
Visualize the Average U.S. Gasoline Price Over Time Using React Line Chart
Swetha Babu
1
2
3
4
1
…
3
4

 Gowrimathi S

 Ilamathi Govindaraj
 Swetha Babu