Try Our Live Demo
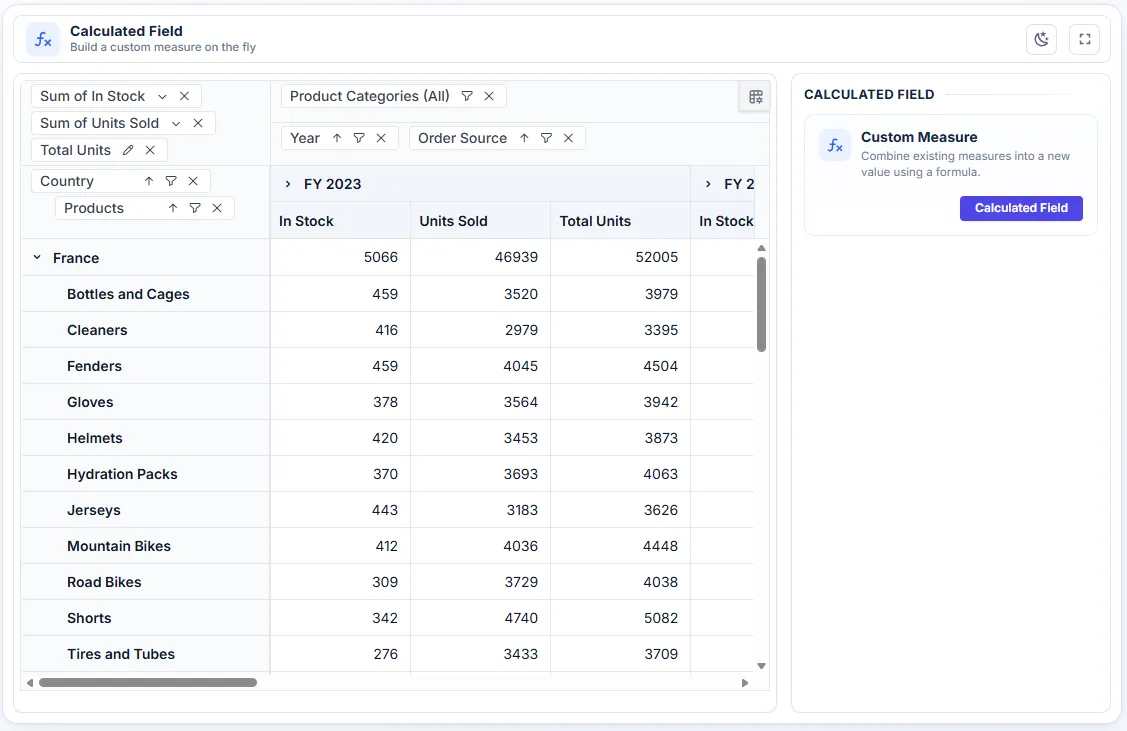
Analyze data with custom metrics
Create calculated fields to answer business questions and derive new metrics from existing data using a formula builder.
Formula-driven analysis
Design custom calculations by combining existing fields with built-in operators, using a formula builder dialog instead of writing code.
Calculate custom business metrics
Calculate profit margins, growth rates, percentages, ratios, and other composite metrics directly from existing Pivot Table fields.
Real-time metric updates
Calculated fields re-aggregate automatically when source data changes, filters are applied, or the pivot layout is reorganized, keeping values current.
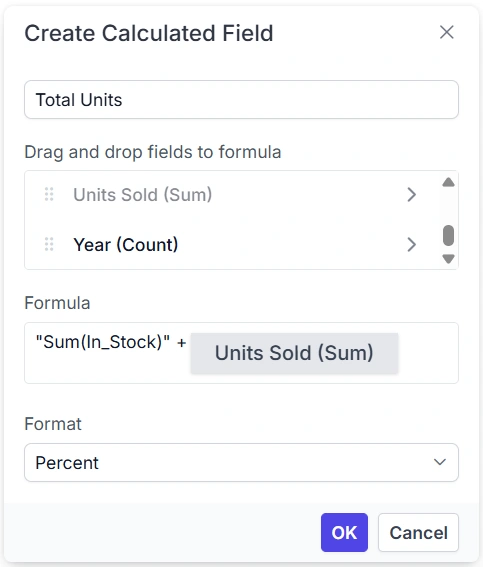
Create formulas with drag-and-drop
Create calculated fields using a formula builder dialog, dragging fields into formulas and applying arithmetic, logical, and comparison operators without writing code. Use this feature when a new metric needs to be derived from existing fields.
- Profit margin calculations
- Year-over-year growth comparisons
- Weighted average score calculations
- Percent-of-total composition analysis
Calculated fields in Values axis
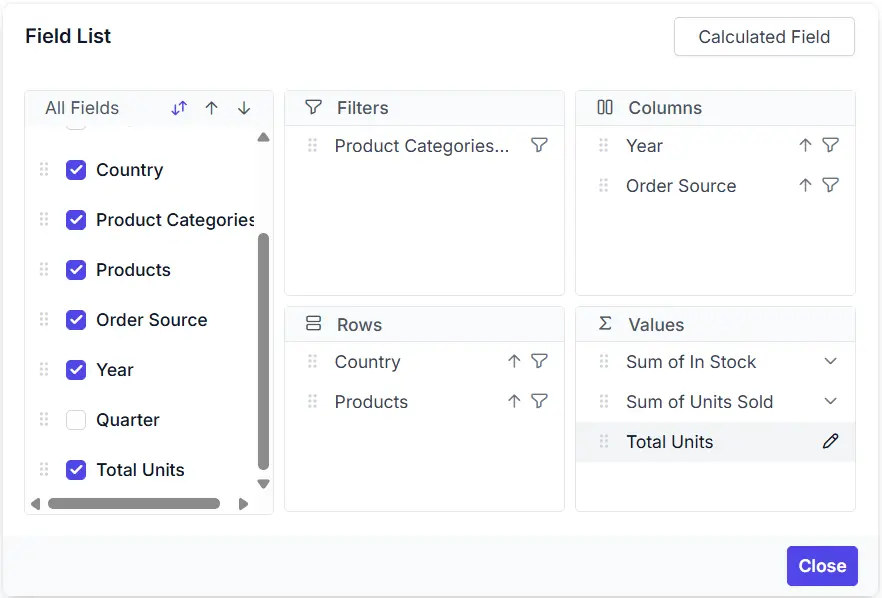
Calculated fields behave like source value fields once created, appearing in the field list and the Values axis alongside other measures. Use this feature when a custom metric needs to be aggregated the same way as any other value field.
- Regional profit margin tracking
- Marketing channel cost comparisons
- Multi-metric product analysis
- Cross-region performance benchmarking
Build business metrics with operators
Combine aggregate functions with arithmetic, logical, and comparison operators to build calculations for performance measurement, KPI tracking, and trend analysis. Use this feature when a metric requires conditional logic or combined calculations.
- Conditional KPI threshold formulas
- Multi-condition sales qualification rules
- Weighted scoring model formulas
- Trend-based performance calculations
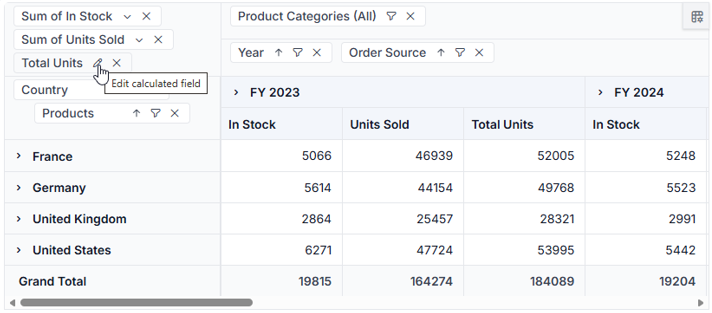
Manage calculated field definitions
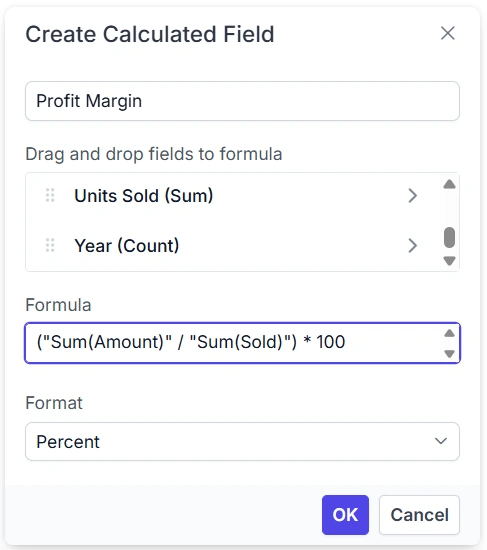
Edit formulas, rename calculations, and remove unused fields from the pivot structure, with changes applied instantly as formulas recalculate. Use this feature when formulas need to be revised or reused across reports.
- Formula updates after policy changes
- Removing outdated experimental metrics
- Reusing formulas across departments
- Exporting reports with formulas intact
Platform support
Use Calculated Fields across platforms
Calculated Fields are available across web, desktop, and cross-platform frameworks. Formula builder, field creation, and real-time recalculation work consistently across all supported platforms.
| Capability | JS, React, Angular, Vue | Blazor | ASP.NET Core & MVC | WPF & UWP | WinForms |
|---|---|---|---|---|---|
| Create calculated fields | |||||
| Formula builder dialog | |||||
| Edit and delete calculated fields | |||||
| Aggregate functions (Sum, Avg, Count, etc.) | |||||
| Real-time recalculation on data refresh |
Frequently Asked Questions
What does a calculated field do in a Pivot Table?
A calculated field is a custom value created from existing Pivot Table fields using a formula. For example, dividing profit by revenue creates a Profit Margin field. The result appears in the field list and Values axis with other measures.
Where do calculated fields appear in a Pivot Table?
Calculated fields appear in the Pivot Table Values axis, where they behave like other value fields. They are aggregated with the report data and remain available during Pivot Table operations such as sorting, filtering, and drilling.
When does a Pivot Table update calculated fields?
A Pivot Table recalculates calculated fields when source data is refreshed, filters change, or the report layout is updated. This keeps each calculated value synchronized with the currently displayed and aggregated data.
Is coding needed for Pivot Table calculated fields?
No. The Pivot Table formula builder lets users drag fields, choose operators, and configure formulas visually. Calculations can combine functions such as Sum(), Avg(), and Count() with operators, so users do not need to write code.
Which formulas work in Pivot Table calculated fields?
Pivot Table calculated fields support arithmetic, comparison, logical, and conditional operators. They also support Sum(), Avg(), Count(), Min(), Max(), utilities such as abs() and isNaN(), and JavaScript Math methods.
Can Pivot Table exports include all calculated fields?
Yes. Pivot Table exports to Excel, PDF, and CSV include calculated fields and their resulting values. Recipients can view every exported metric and continue analyzing the report data in the selected output format.
Resources
Learn more about Pivot Table Calculated Fields
Explore demos, KB articles, and documentation to get the most out of Pivot Table Calculated Fields.
Explore guides, APIs, and quick-start tips
See live use cases in action
Ask, share, and connect with peers
Find solutions and best practices fast
Get expert help when needed
Feature requests and bug reports
Track issues and suggest improvements
Awards
Greatness—it’s one thing to say you have it, but it means more when others recognize it. Syncfusion® is proud to hold the following industry awards.