Try Our Live Demo
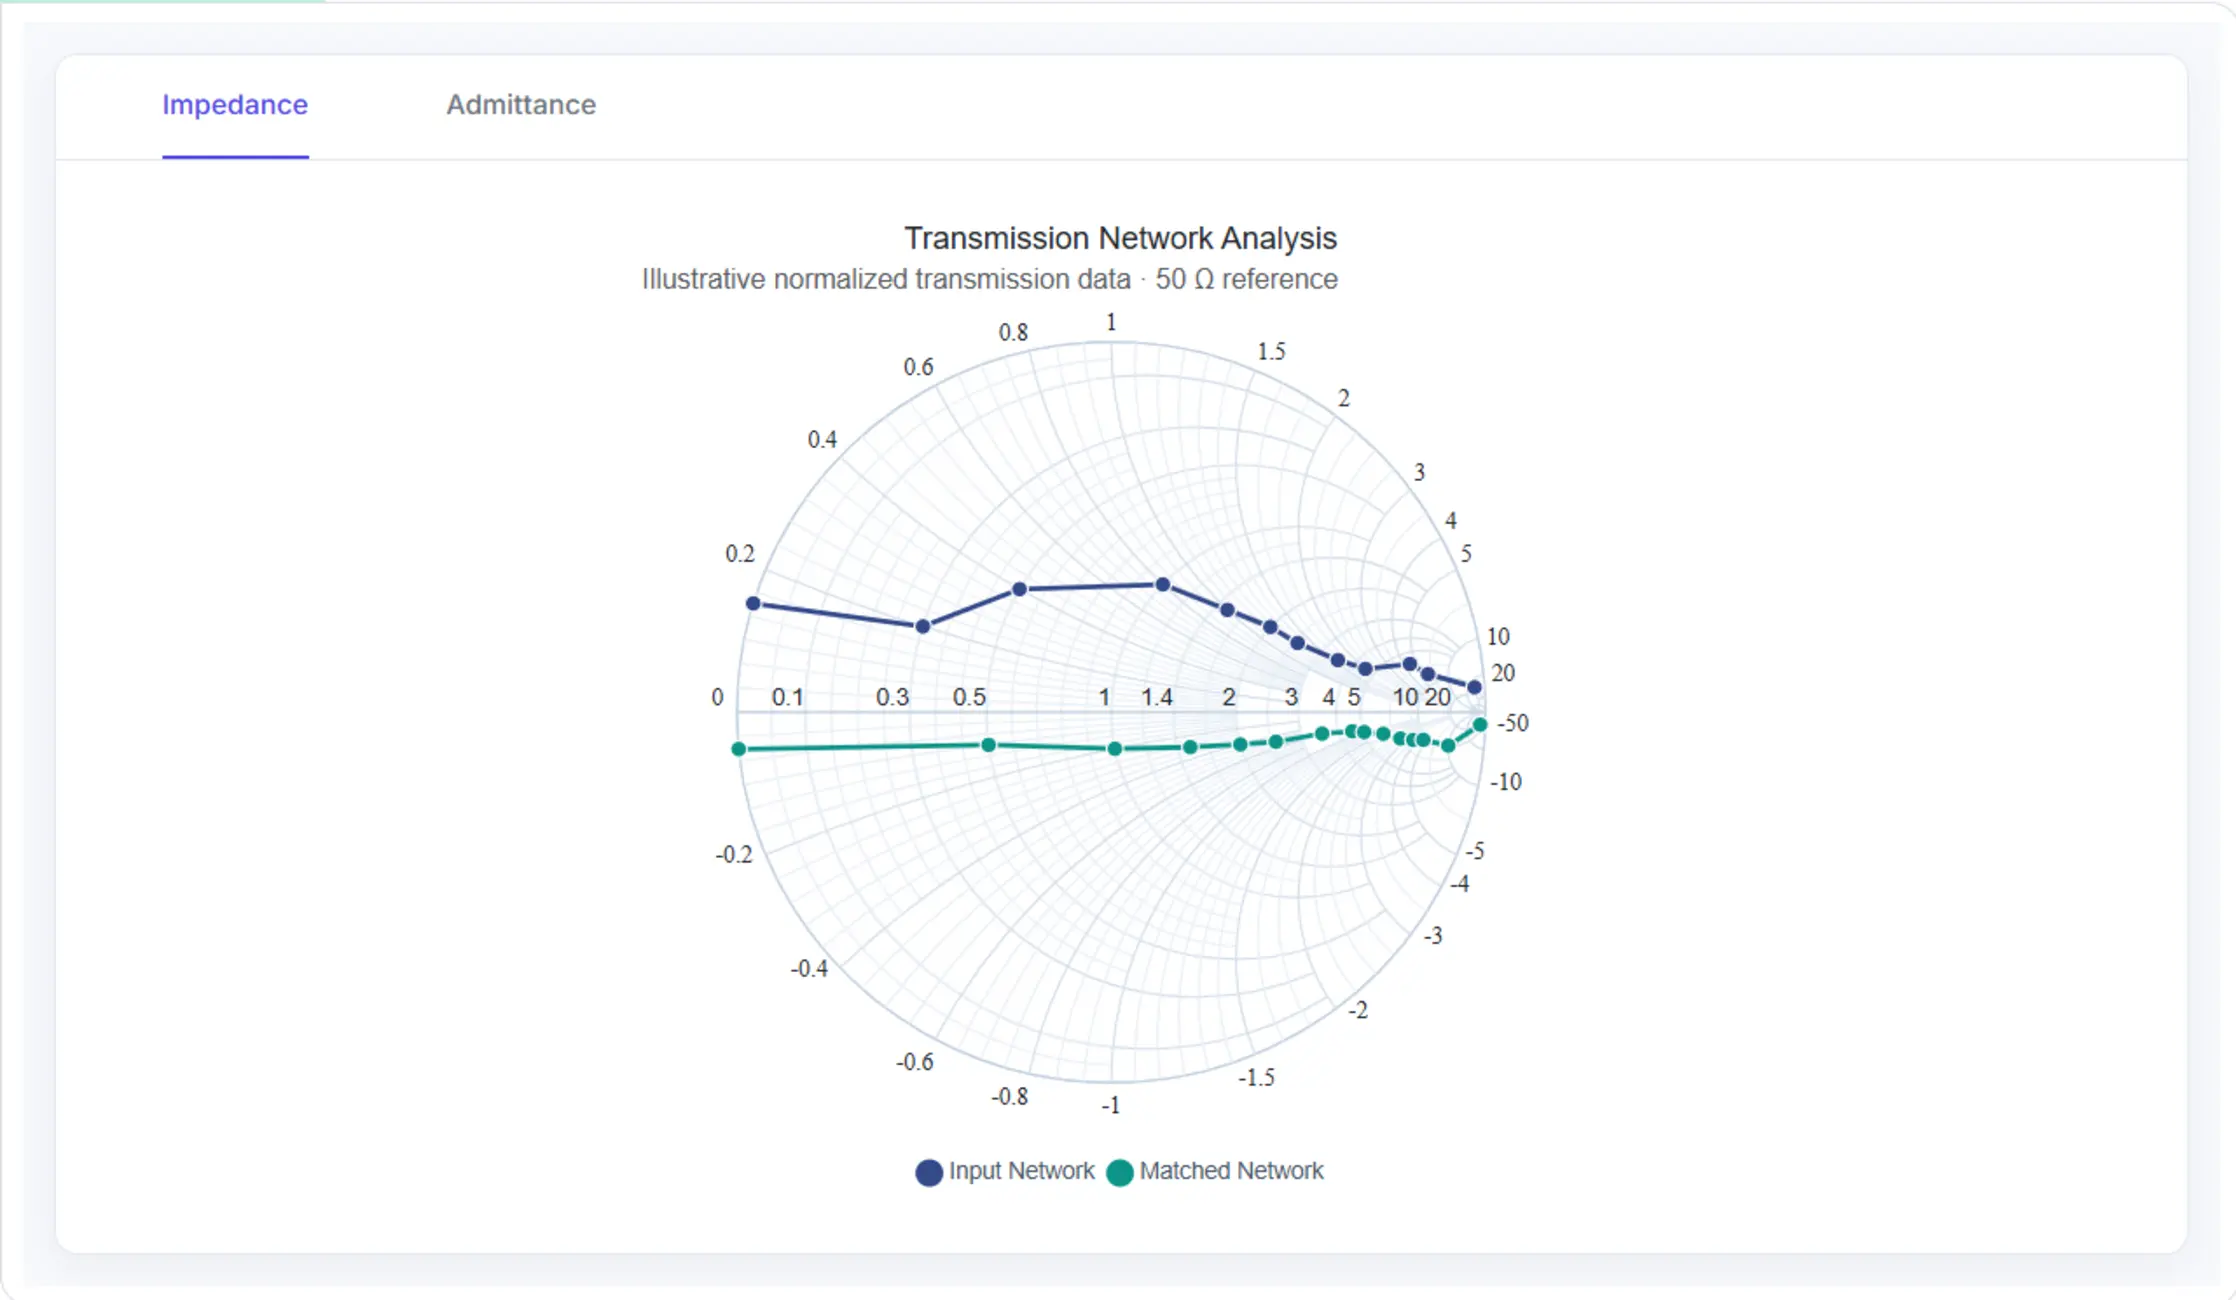
Analyze High-Frequency Circuit Behavior
Smith Charts simplify the visualization of complex impedance and transmission line characteristics, helping engineers evaluate RF networks, matching circuits, antennas, and microwave systems.
Visualize impedance relationships
Display impedance characteristics using the industry-standard Smith Chart representation for RF and high-frequency circuit analysis.
Analyze transmission line performance
Understand reflection behavior, matching characteristics, and signal propagation across transmission systems.
Customize engineering visualizations
Adapt series appearance, markers, labels, and interactive elements to support specific engineering workflows.
Visualize Impedance and Admittance Data
Represent complex impedance characteristics using the industry-standard Smith Chart layout. Use it when RF circuit behaviors must be analyzed, since the layout visualizes impedance and admittance properties across networks and transmission systems.
- Display impedance and admittance characteristics.
- Visualize complex RF network behavior.
- Analyze matching and reflection properties.
- Support impedance matching, antenna design, and microwave network analysis.
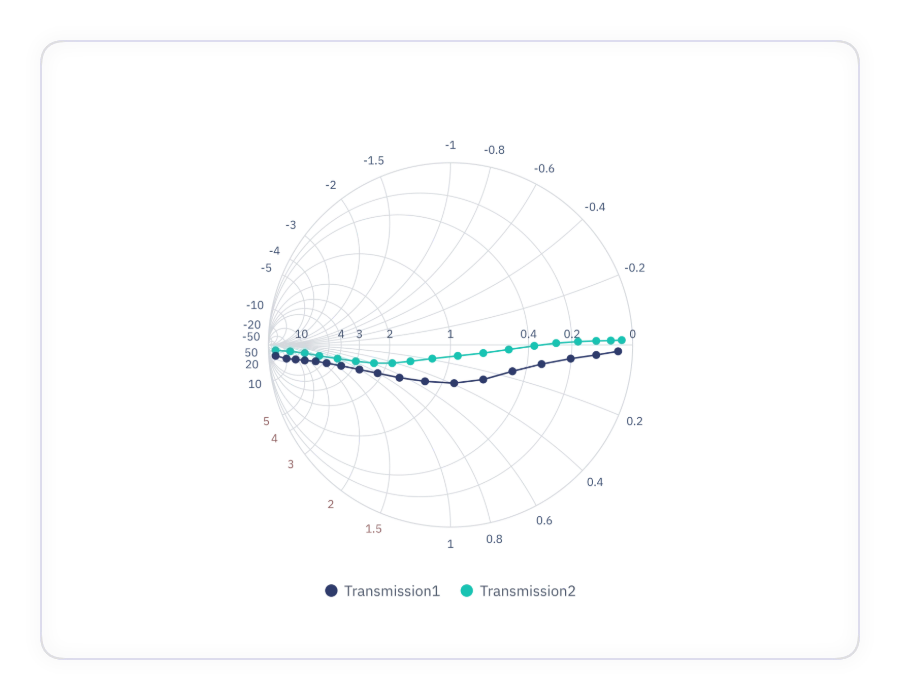
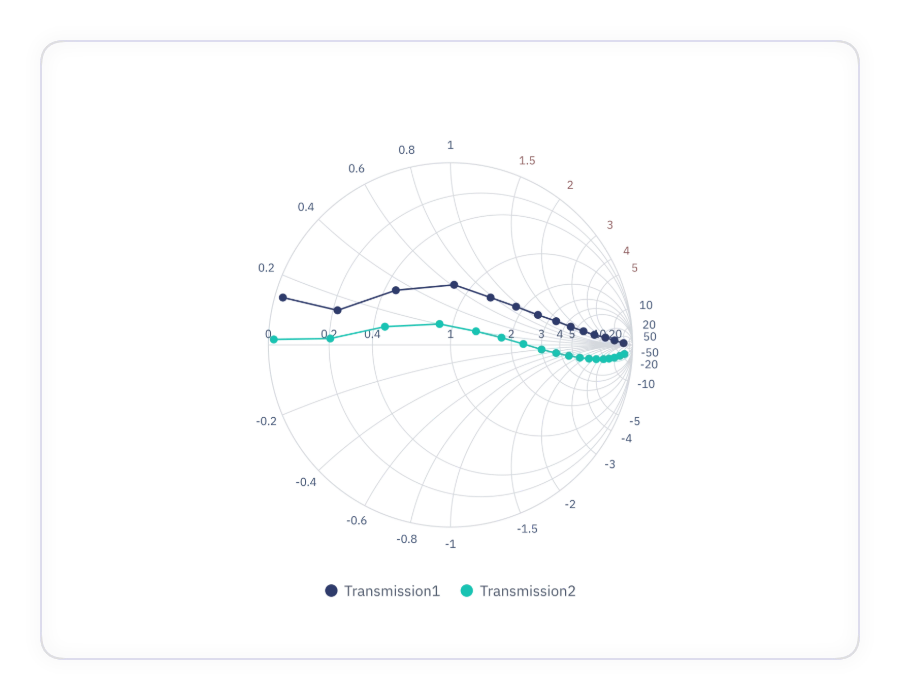
Analyze Transmission Line Characteristics
Evaluate transmission line performance using intuitive visual representations of impedance behavior. Use it when RF or microwave network characteristics must be analyzed, since the visualization supports impedance matching and signal flow analysis.
- Analyze transmission line parameters.
- Investigate RF and microwave systems.
- Support impedance matching workflows.
- Help engineers evaluate matching circuits and antenna performance.
Customize Series and Markers
Configure series styles, markers, colors, and visual settings to represent engineering data clearly and consistently. Use it when series must be differentiated, since customization supports multiple datasets and consistent visual standards.
- Customize markers and series appearance.
- Distinguish multiple datasets.
- Match organizational visual standards.
- Reveal measurement differences across operating conditions.
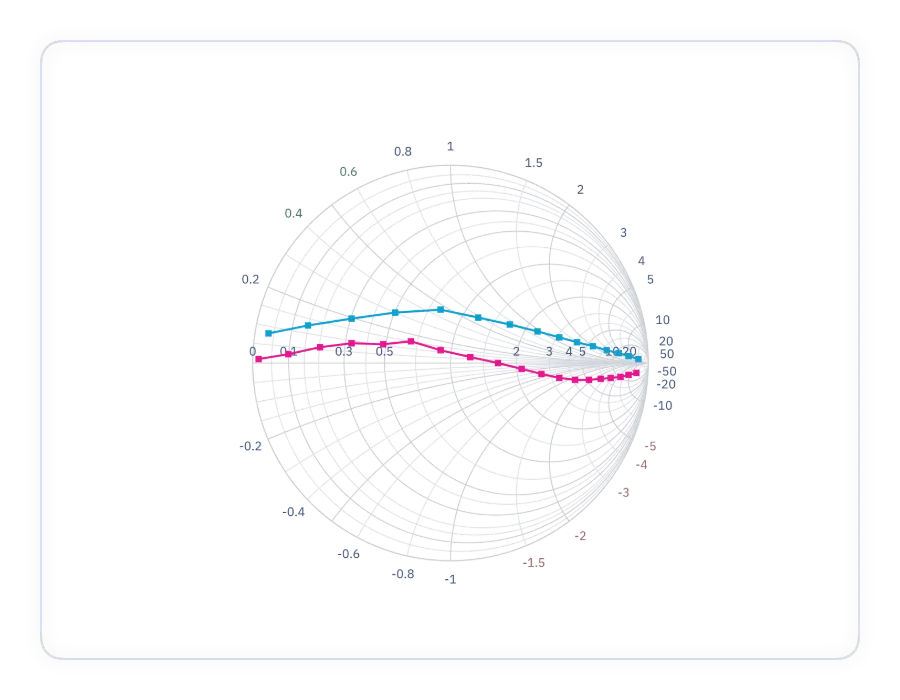
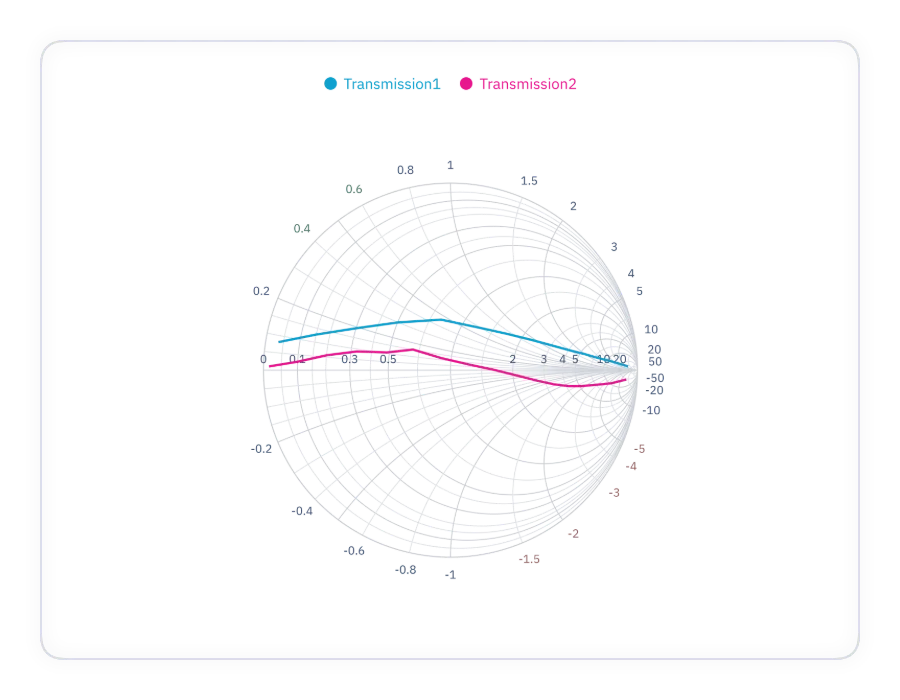
Display Legends and Data Labels
Provide additional context through legends and labels to make engineering data more readable. Use them when series and values must be quickly identified, since legends and labels support clearer reading of engineering visualizations.
- Identify series using legends.
- Display important data values.
- Improve readability of engineering visualizations.
- Add series names and value annotations where needed.
Interactive Tooltips
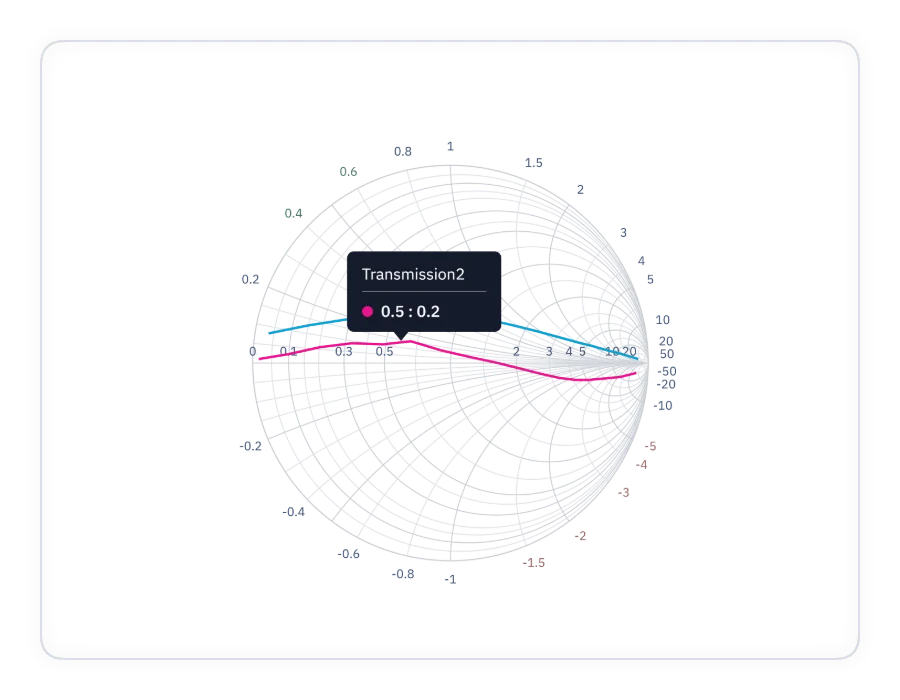
Enable users to inspect impedance points and engineering measurements quickly through interactive tooltips. Use them when detailed inspection is required, since tooltips support analysis, exploration, and validation workflows.
- Display detailed values on hover.
- Improve engineering analysis workflows.
- Support data exploration and validation.
- Enable quick inspection of impedance points and measurements.
GUIDED RF ANALYSIS WORKFLOW
Analyze impedance characteristics in four steps
Engineers can load impedance measurements, configure Smith Chart series, evaluate transmission-line behavior, and export results for reporting and design reviews.
01
Load measurement data
Provide impedance, admittance, or network measurement values collected from simulations or test equipment.
02
Configure visualization
Display one or more measurement series on the Smith Chart.
03
Analyze circuit behavior
Evaluate impedance matching, reflection characteristics, and transmission-line performance.
04
Share findings
Export or print visualizations for engineering reviews, documentation, and reporting.
PLATFORM SUPPORT
Render Smith Chart across platforms
Core Smith Chart samples are available across web, desktop, and cross-platform frameworks. Availability varies by feature for default rendering, customization, and print and export capabilities.
| Capability | JS, React, Angular, Vue | Blazor | ASP.NET Core & MVC | WPF & WinForms | .NET MAUI | Flutter |
|---|---|---|---|---|---|---|
| Default Smith Chart | ||||||
| Smith Chart customization | ||||||
| Direct print | ||||||
| Export | ||||||
| Transmission line parameter rendering | ||||||
| High-frequency circuit visualization |
Frequently Asked Questions
What is the Smith Chart in Syncfusion Charts?
A Smith Chart is a specialized engineering visualization used to analyze impedance, admittance, and transmission line characteristics in RF and microwave systems.
Can multiple datasets be displayed?
Yes. Smith Charts support multiple series, allowing engineers to compare different measurements and operating conditions.
Are Smith Charts suitable for RF applications?
Yes. Smith Charts are widely used for RF engineering, microwave systems, antenna design, and transmission line analysis.
When should engineers use a Smith Chart?
Use a Smith Chart when working with impedance matching, antenna design, transmission lines, RF circuits, and microwave network analysis.
Can Smith Charts be customized?
Yes. The Smith Chart supports series appearance, markers, labels, legends, and interactive behavior customization.
Can Smith Charts be exported?
Yes. Smith Charts support printing and exporting for use in engineering reports, presentations, and documentation.
Resources
Learn more about our Smith Chart
Explore demos, KB articles, and documentation to get the most out of Smith Chart for high-frequency circuits.
Explore guides, APIs, and quick-start tips
See live use cases in action
Ask, share, and connect with peers
Find solutions and best practices fast
Get expert help when you need it
Feature requests and bug reports
Track issues and suggest improvements
Awards
Greatness—it’s one thing to say you have it, but it means more when others recognize it. Syncfusion® is proud to hold the following industry awards.