Try Our Live Demo
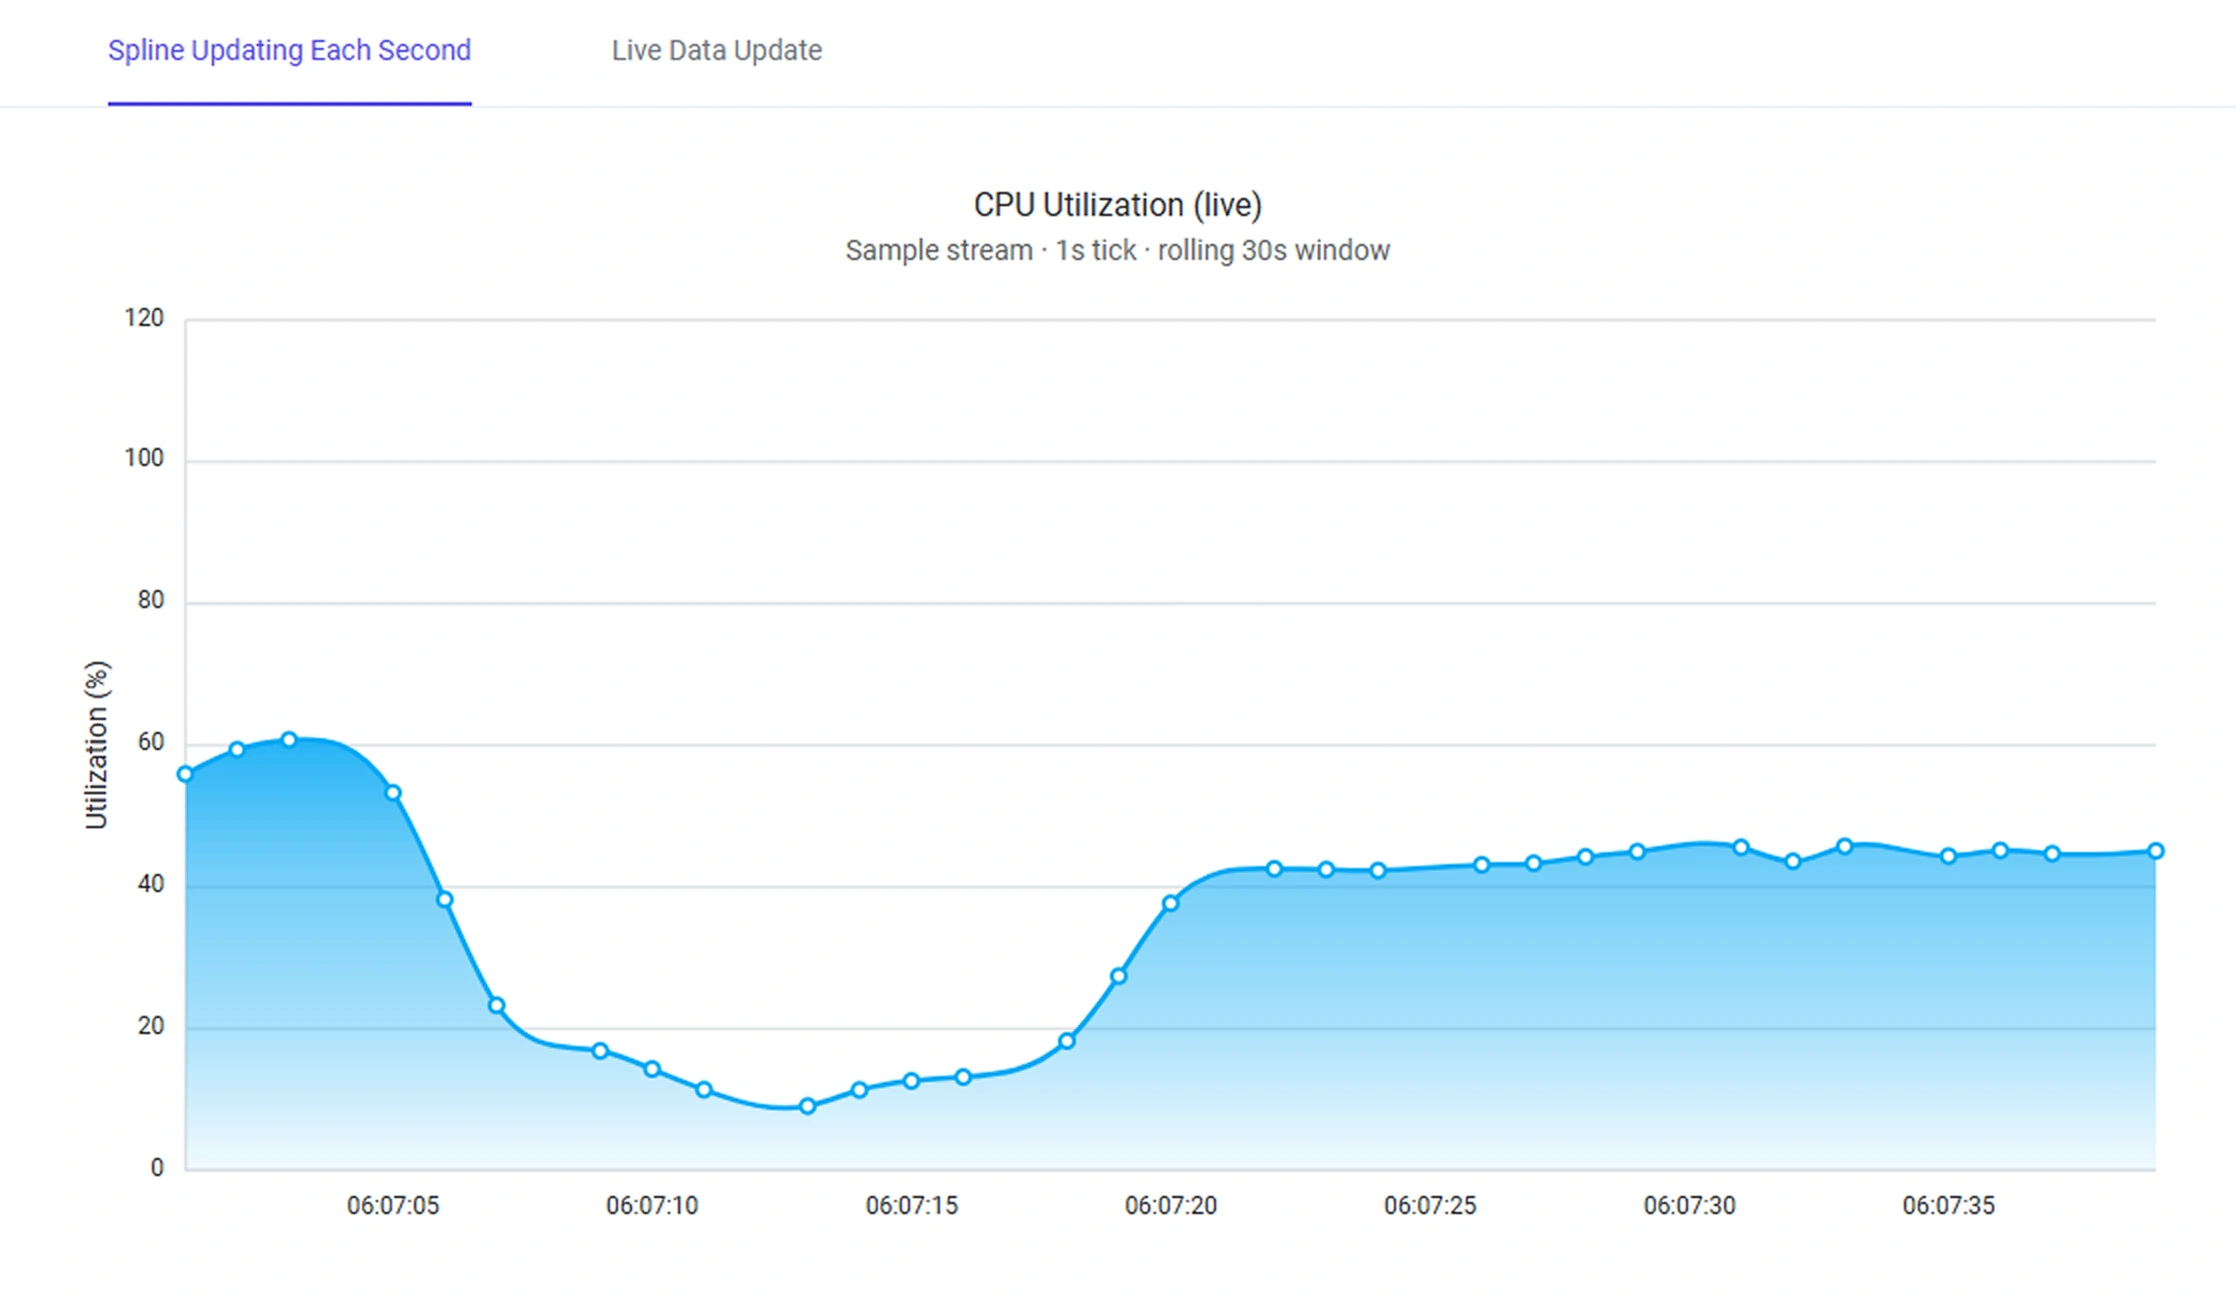
Keep charts synchronized with live data
Replace datasets, stream new points, and remove outdated values without recreating the chart or losing user interactions.
Replace datasets for real-time updates
Replace a complete dataset without recreating the chart or resetting its configuration.
Add points with data streaming
Add data points as new values arrive while users continue viewing the existing data.
Remove points from rolling windows
Remove older points while retaining the most recent values in a rolling data window.
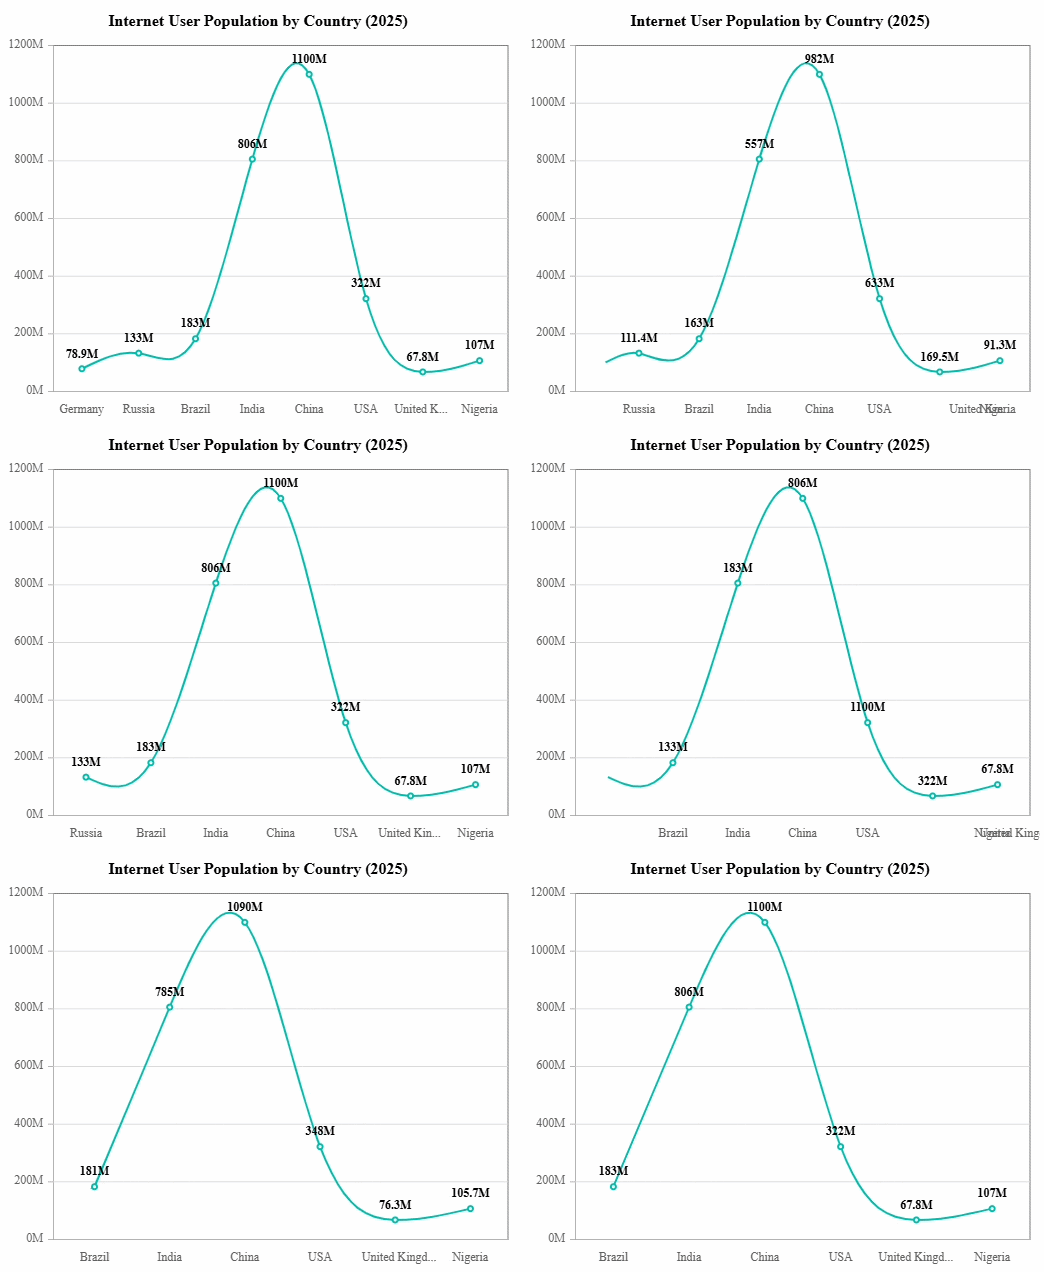
Replace datasets for real-time updates
Replace a complete dataset without recreating the chart or resetting its configuration. Use it when refreshed data is delivered from a scheduled process or data source, since the chart retains appearance and interactions during updates.
- Replace the entire dataset without recreating the chart.
- Retain chart configuration, styling, and user interactions.
- Apply refreshed data from scheduled jobs or push-based sources.
- Keep zoom, pan, selection, and tooltip state during updates.
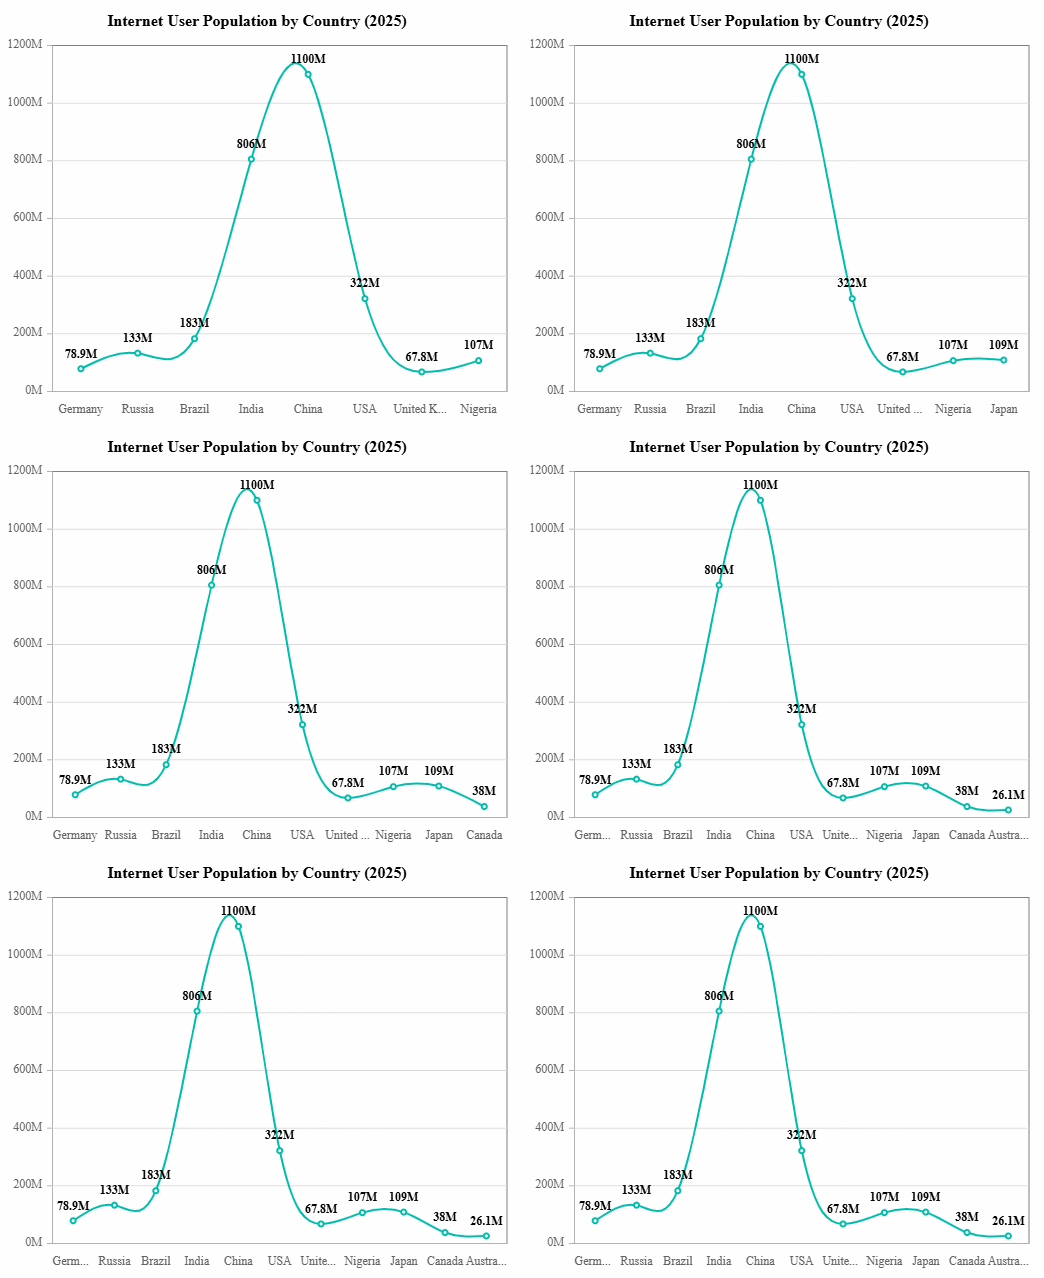
Add points with data streaming
Add data points as new values arrive without recreating the chart. Use it for live feeds, streaming metrics, or continuously measured values, since the series extends while users continue viewing existing data.
- Append new data points to an existing series as values arrive.
- Stream live feeds, telemetry, and continuously measured values.
- Preserve zoom, pan, tooltip, and selection state during updates.
- Combine with rolling windows to keep focus on recent activity.
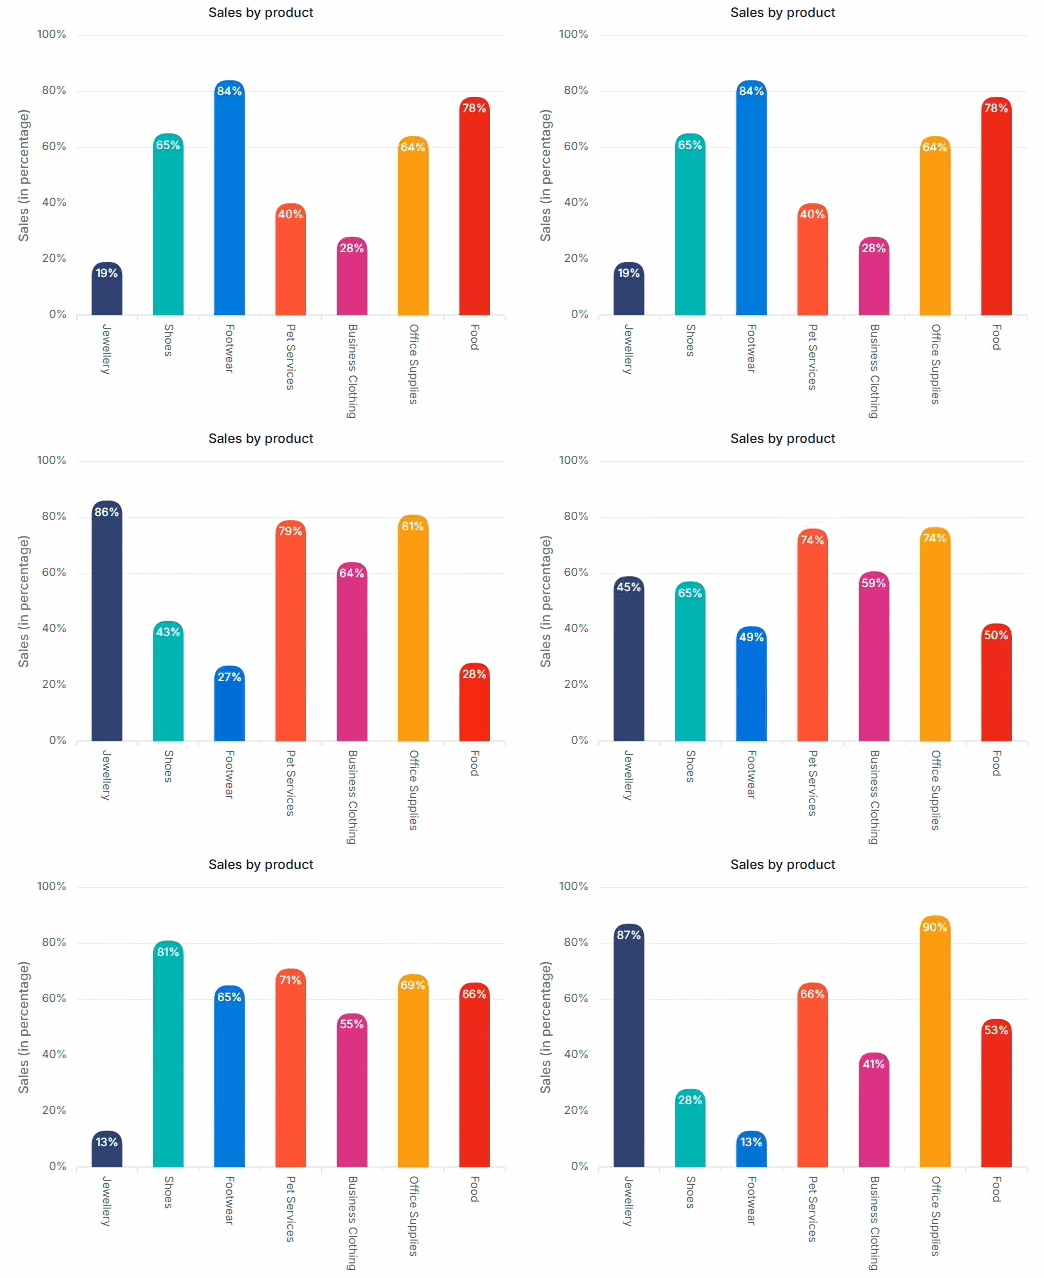
Remove points from rolling windows
Remove older points while retaining the most recent values in a rolling data window. Use it when the chart must stay focused on current measurements, since rolling windows limit the displayed time range.
- Drop older points to keep the chart focused on the most recent values.
- Maintain a rolling time window for live and streaming datasets.
- Define custom retention periods and removal strategies.
- Combine with point addition to support continuous, time-based updates.
GUIDED REAL-TIME UPDATES
Stream live data without disrupting the chart
Developers can wire up streaming data sources, decide how to update the chart, and keep user interactions intact while values change in real time.
01
Connect the data source
Subscribe to a live data source such as a WebSocket, polling endpoint, signalR hub, or in-app stream.
02
Choose an update mode
Decide whether to replace the dataset, append new points, or remove older points to maintain a rolling window.
03
Update the chart
Call the chart update API to apply new values without recreating the chart or resetting its state.
04
Keep interactions alive
Let users continue zooming, panning, hovering, and selecting while data streams in the background.
PLATFORM SUPPORT
Stream real-time updates across platforms
Real-time update capabilities are available across web, desktop, and cross-platform frameworks. Availability of specific update modes such as append, remove, and rolling-window replacement may vary by platform.
| Capability | JS, React, Angular, Vue | Blazor | ASP.NET Core & MVC | WPF & WinForms | .NET MAUI | Flutter |
|---|---|---|---|---|---|---|
| Replace dataset without recreating chart | ||||||
| Append new data points (streaming) | ||||||
| Remove outdated data points | ||||||
| Rolling time-window updates | ||||||
| Preserve interactions during updates |
Frequently Asked Questions
How do Charts real-time updates keep live data charts current?
Real-time updates keep charts synchronized with changing data without requiring a chart refresh or recreation. New values can be added, removed, or replaced while preserving the existing visualization and configuration.
How do Charts real-time updates handle data streaming?
Data streaming allows charts to add, replace, or remove values while data changes. Existing chart interactions and visual state are preserved during updates.
Which interactions remain available during Charts real-time updates?
Tooltips, zooming, panning, and selection all remain available while Charts add or remove values through data streaming.
When are Charts real-time updates with data streaming useful?
Real-time updates are useful when charts receive continuously changing data from sensors, monitoring systems, business applications, telemetry feeds, or financial data streams.
Can Charts real-time updates keep large live data charts responsive?
Yes. Real-time updates are designed for continuously changing datasets while maintaining interactive chart behavior and responsive user experiences.
How do Charts real-time updates manage older points?
Charts real-time updates can remove older points automatically or selectively. This keeps real-time data visualization focused on the configured time window.
Resources
Learn more about our Charts
Explore demos, KB articles, and documentation to get the most out of our charts.
Explore guides, APIs, and quick-start tips
See live use cases in action
Ask, share, and connect with peers
Find solutions and best practices fast
Get expert help when you need it
Feature requests and bug reports
Track issues and suggest improvements
Awards
Greatness—it’s one thing to say you have it, but it means more when others recognize it. Syncfusion® is proud to hold the following industry awards.