Try Our Live Demo
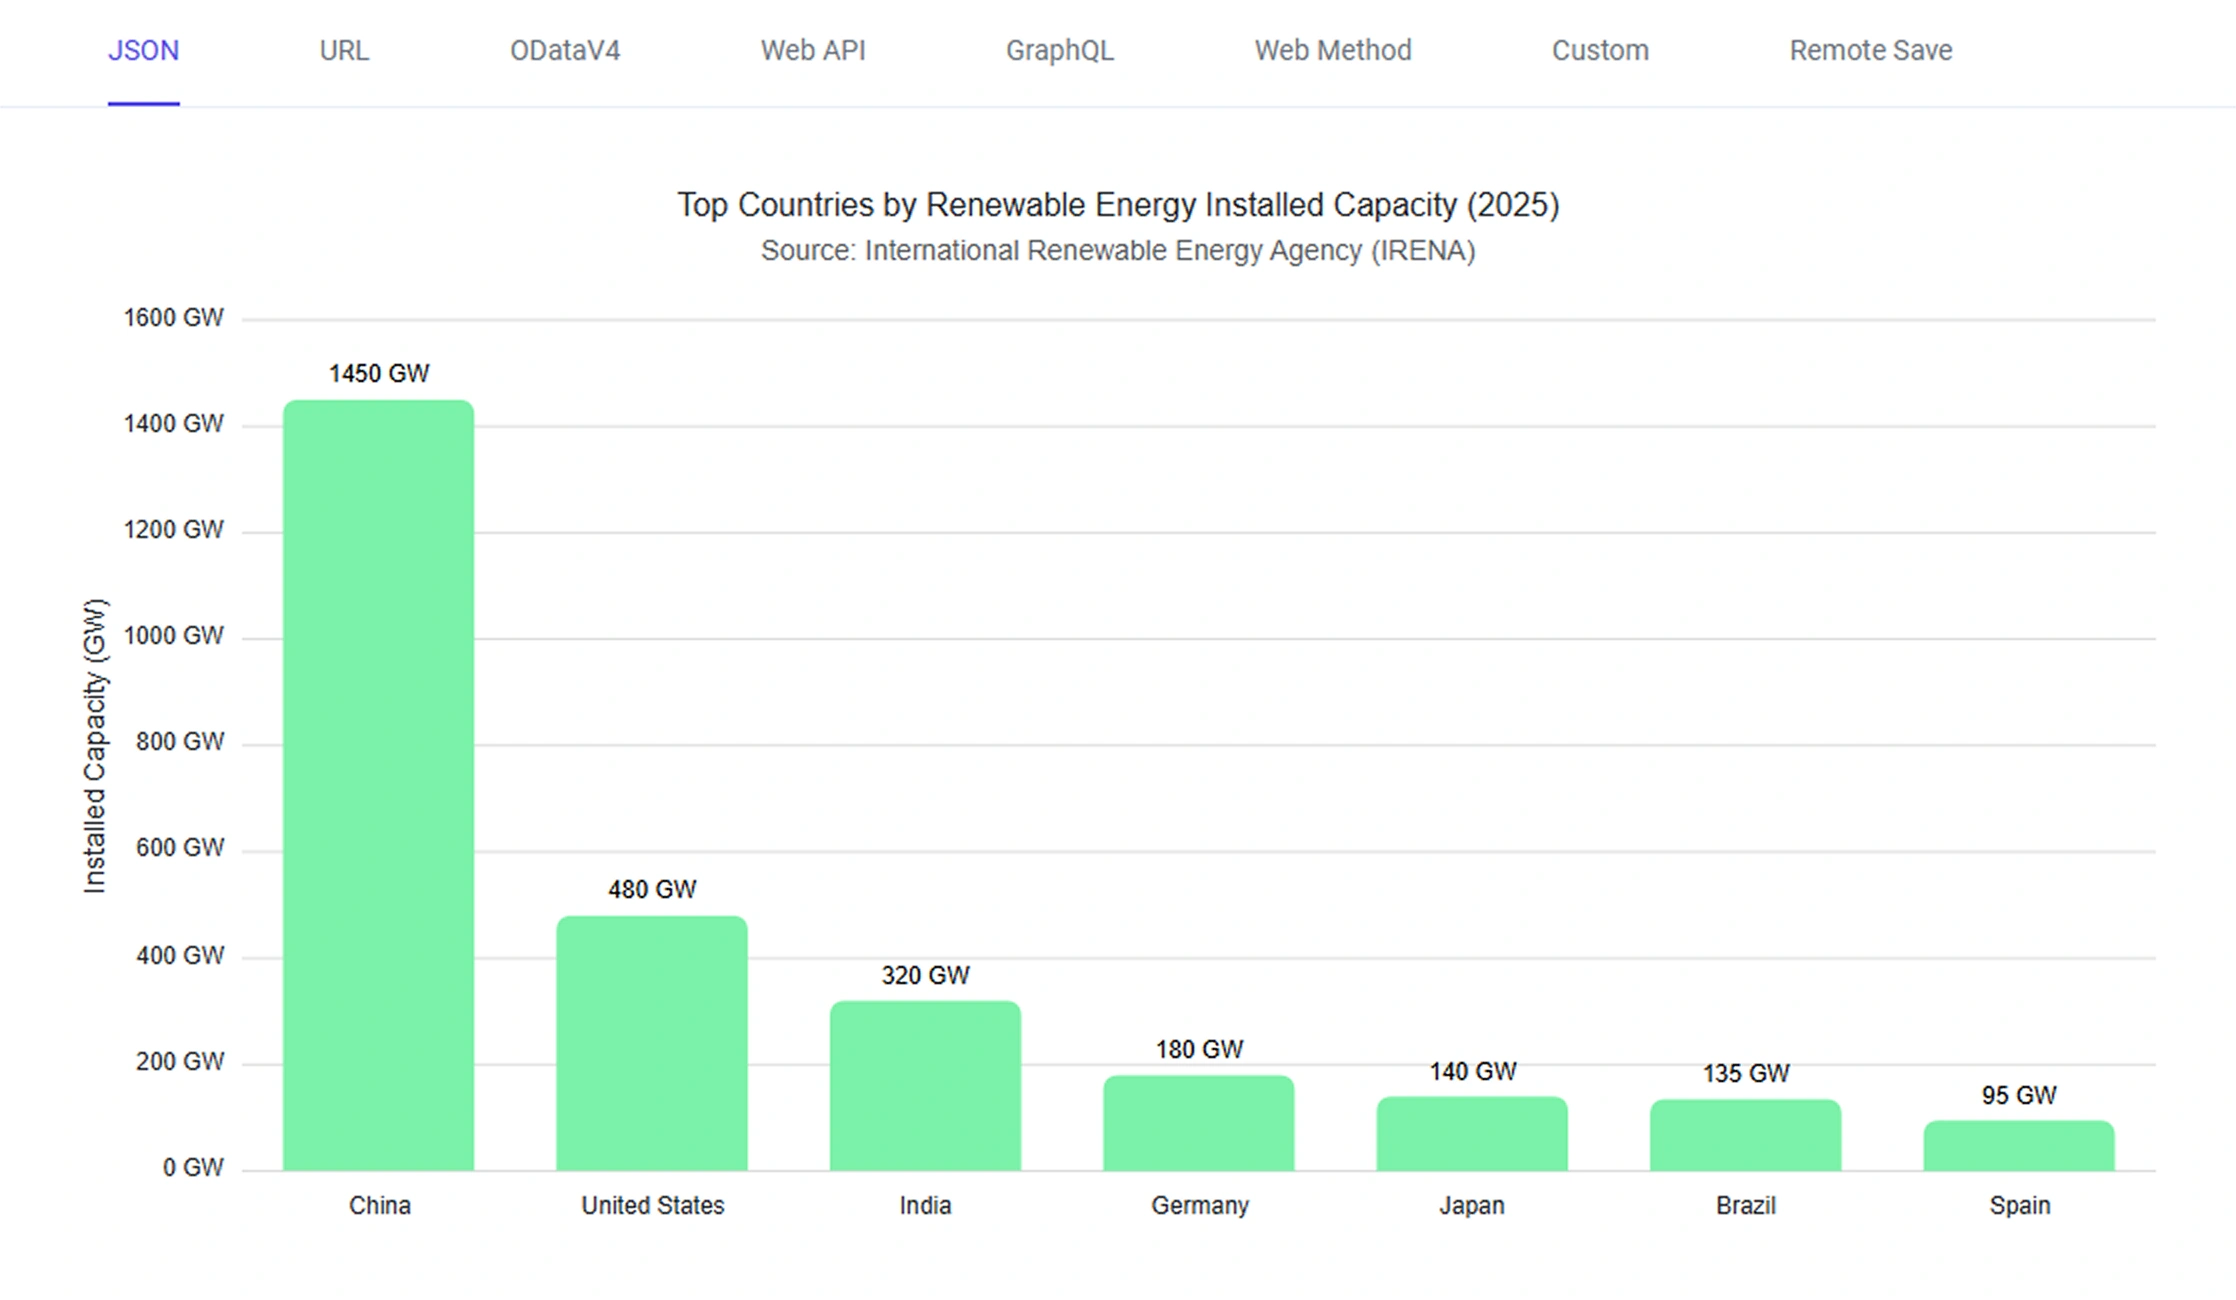
Connect any data source with one consistent model
Choose from six built-in adaptors to bind charts to local data, REST APIs, OData services, GraphQL endpoints, and custom backends without changing the chart component.
Bind local in-memory data
The JSON adaptor binds chart data directly from local JavaScript objects and arrays without server communication.
Connect to general REST endpoints
The URL adaptor retrieves chart data from REST APIs and external web services using HTTP requests.
Bind OData V4 service endpoints
The OData V4 adaptor connects charts to OData-compliant services using the OData V4 protocol.
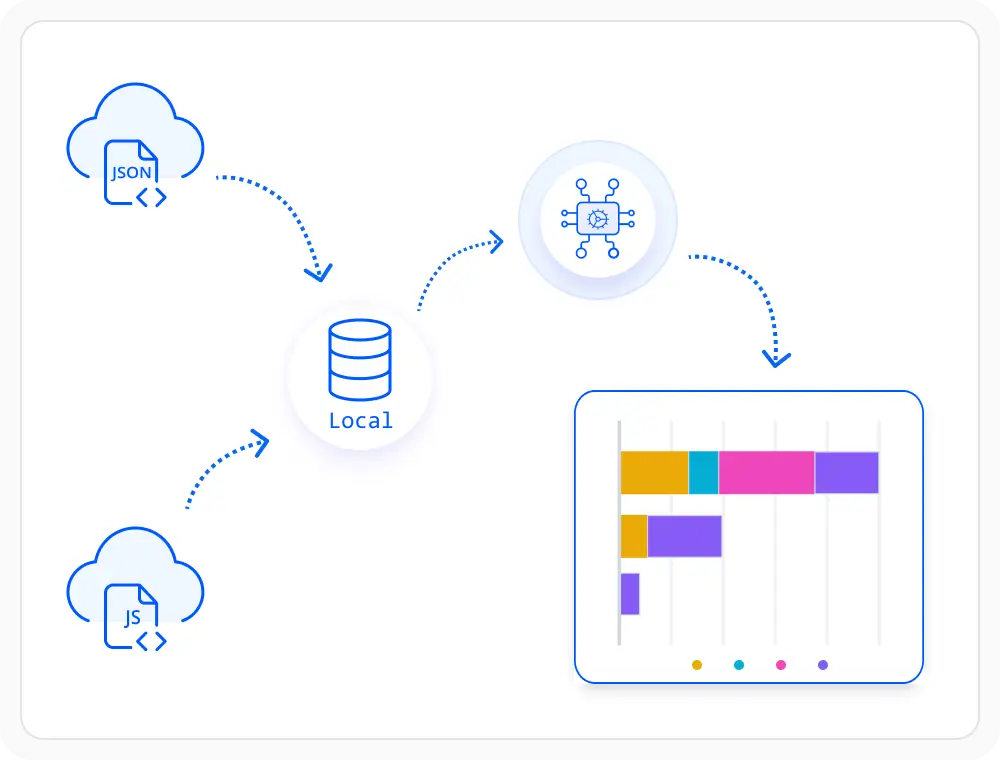
Local data binding with the JSON adaptor
The JSON adaptor binds chart data directly from local JavaScript objects and arrays without server communication. Use it when data is available client-side, since operations run within the browser for fast access to local datasets.
- Bind chart data directly from local JavaScript objects and arrays.
- Perform all data operations in the browser for fast access.
- Use static, cached, or client-side datasets without server calls.
- Combine local data with chart-specific configuration in a single source.
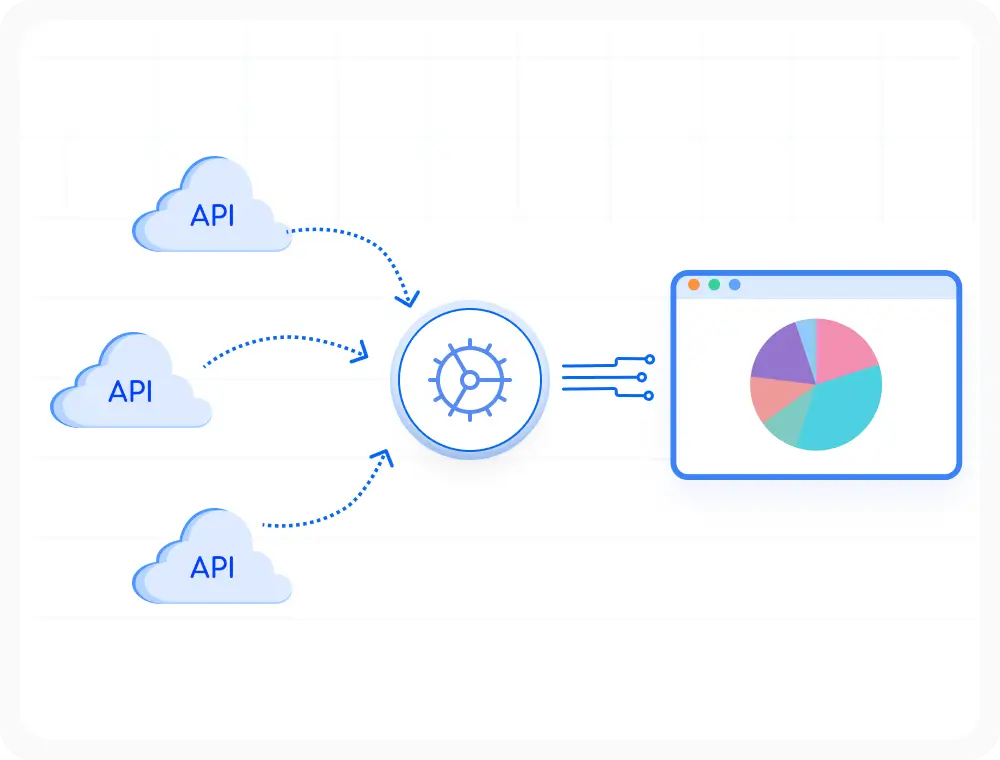
General REST endpoints with the URL adaptor
The URL adaptor retrieves chart data from REST APIs and external web services using HTTP requests. Use it when remote data must be visualized, since minimal configuration enables dynamic data from web services and third-party APIs.
- Retrieve chart data from REST APIs and external web services.
- Display dynamic data from remote sources with minimal configuration.
- Connect charts to microservices and third-party APIs.
- Work with any standard REST-compliant endpoint without extra setup.
OData V4 service integration
The OData V4 adaptor connects charts to OData-compliant services using the OData V4 protocol. Use it when enterprise applications expose data through OData V4, since standardized querying and filtering simplify integration.
- Connect to OData-compliant services using the OData V4 protocol.
- Standardize querying, filtering, and data access patterns.
- Integrate with enterprise applications built on OData V4.
- Reuse the same data access model across charts and grids.
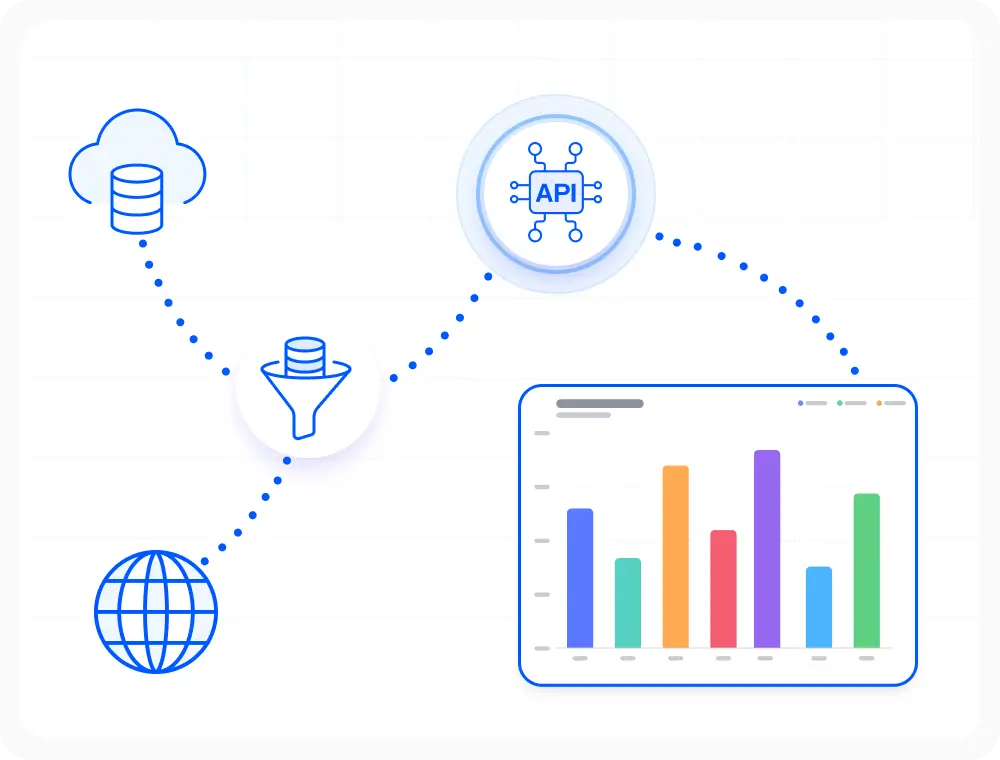
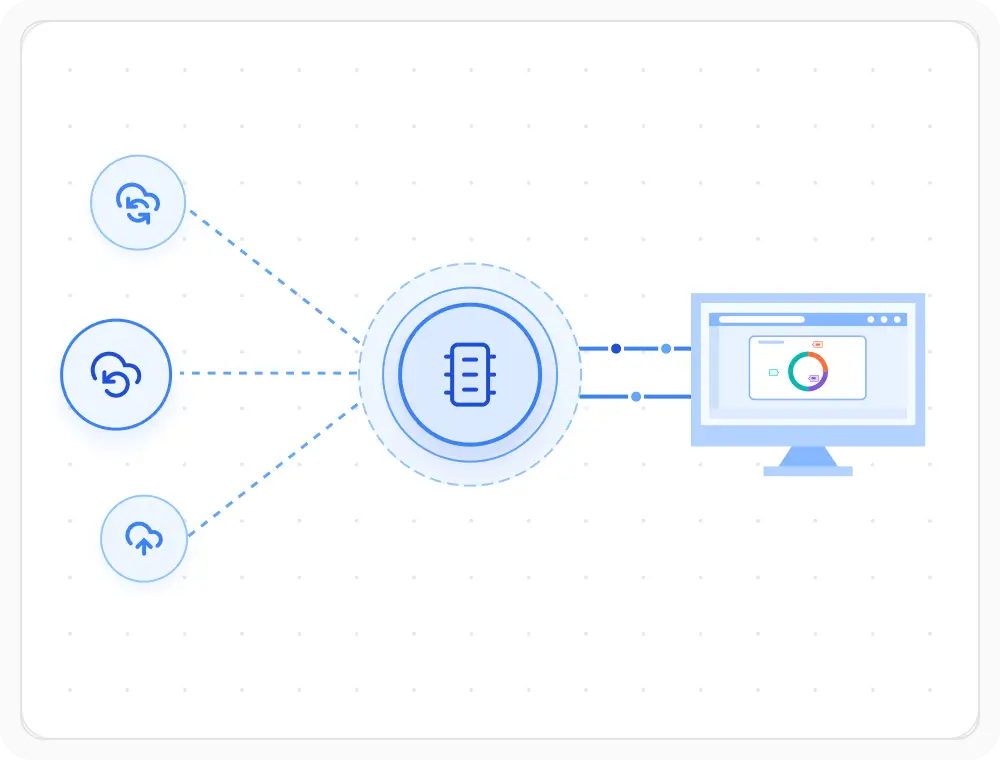
ASP.NET Web API integration
The Web API adaptor connects charts to ASP.NET Web API services using a consistent data binding model. Use it when Microsoft-based applications expose data through Web API endpoints, since consistent binding supports server-side operations.
- Connect charts to ASP.NET Web API services with a consistent binding model.
- Support server-side data operations and business logic.
- Integrate with Microsoft-based business applications.
- Reuse existing Web API endpoints across charts and other components.
GraphQL server integration
The GraphQL adaptor connects charts to GraphQL services and retrieves only the fields required for visualization. Use it when applications expose data through GraphQL, since field-level queries reduce transfer and improve performance.
- Connect charts to GraphQL services with field-level queries.
- Retrieve only the fields required for chart visualization.
- Reduce unnecessary data transfer and improve performance.
- Consume complex and nested data sources efficiently.
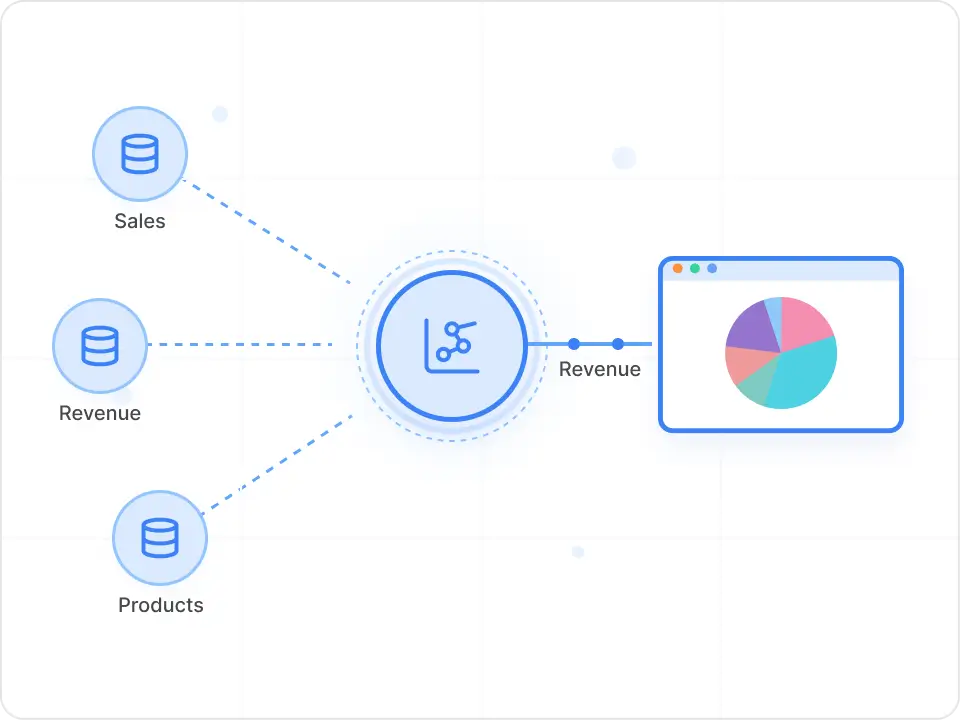
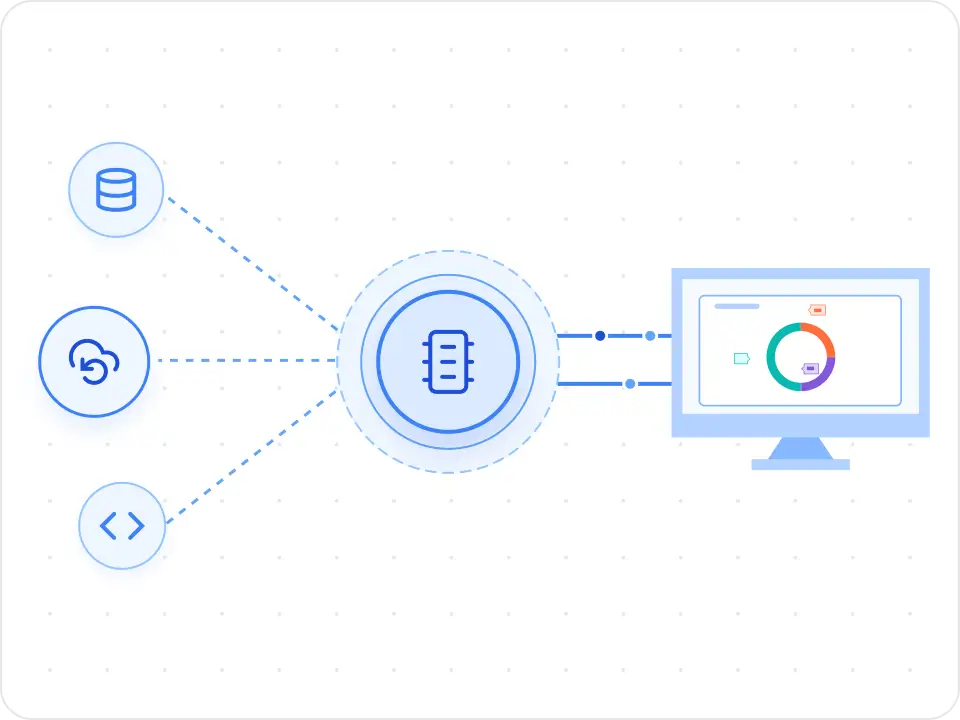
Custom adaptors for unique data sources
Custom adaptors allow charts to connect to unique or unsupported data sources by customizing how data is retrieved, transformed, and bound. Use them when built-in adaptors do not satisfy data integration requirements; they provide the flexibility to integrate with specialized systems and application-specific APIs.
- Connect charts to unique or unsupported data sources.
- Customize how data is retrieved, transformed, and bound.
- Integrate with specialized systems and application-specific APIs.
- Extend the data binding layer beyond the built-in adaptors.
GUIDED DATA INTEGRATION
Connect charts in four steps
Developers can identify a data source, select the appropriate adaptor, configure data access, and bind results to charts using a consistent integration model.
01
Identify the data source
Choose between local data, REST APIs, OData services, GraphQL endpoints, or custom back-end systems.
02
Select an adaptor
Use the JSON, URL, OData V4, Web API, GraphQL, or custom adaptor that matches the source.
03
Configure data access
Set endpoints, queries, headers, and mappings required for the data source.
04
Bind and visualize
Connect the retrieved data to the chart and render visualizations without changing chart structure.
PLATFORM SUPPORT
Bind data sources across platforms
Charts data adaptors are available across web, desktop, and cross-platform frameworks. Built-in adaptors such as JSON, URL, OData V4, Web API, and GraphQL are available on most platforms, while custom adaptors are supported everywhere.
| Capability | JS, React, Angular, Vue | Blazor | ASP.NET Core & MVC | WPF & WinForms | .NET MAUI | Flutter |
|---|---|---|---|---|---|---|
| Local in-memory data (JSON adaptor) | ||||||
| URL adaptor (general REST) | ||||||
| OData V4 adaptor | ||||||
| Web API adaptor | ||||||
| GraphQL adaptor | ||||||
| Custom adaptors |
Frequently Asked Questions
What is data binding in Charts?
Data binding connects a Charts component to its data source. Built-in adaptors support local arrays, REST APIs, OData services, GraphQL endpoints, Web APIs, and custom backends through a consistent data access model.
What role do data adaptors play in connecting Charts to data services?
A data adaptor helps Charts communicate effectively with different data sources. It converts requests and responses so charts work consistently across systems.
Can Charts switch between data sources?
Yes. In most cases, only the adaptor and data source configuration need to change, while the Charts component itself remains completely unchanged.
How does Charts bind to local data?
Charts can bind directly to local arrays and objects stored in your application. Data loads from memory without server communication, making it suitable for static, cached, and client-side datasets.
When should a custom adaptor be used with Charts?
A custom adaptor is useful in Charts when a service returns a response shape that the built-in adaptors don’t support, or when the response needs extra processing before it can be bound to the chart.
Can Charts connect to GraphQL services?
Yes. The GraphQL adaptor connects Charts to GraphQL endpoints and retrieves only the specific data required for chart visualization.
Resources
Learn more about our Charts
Explore demos, KB articles, and documentation to get the most out of the Charts.
Explore guides, APIs, and quick-start tips
See live use cases in action
Ask, share, and connect with peers
Find solutions and best practices fast
Get expert help when you need it
Feature requests and bug reports
Track issues and suggest improvements
Awards
Greatness—it’s one thing to say you have it, but it means more when others recognize it. Syncfusion® is proud to hold the following industry awards.