Try Our Live Demo
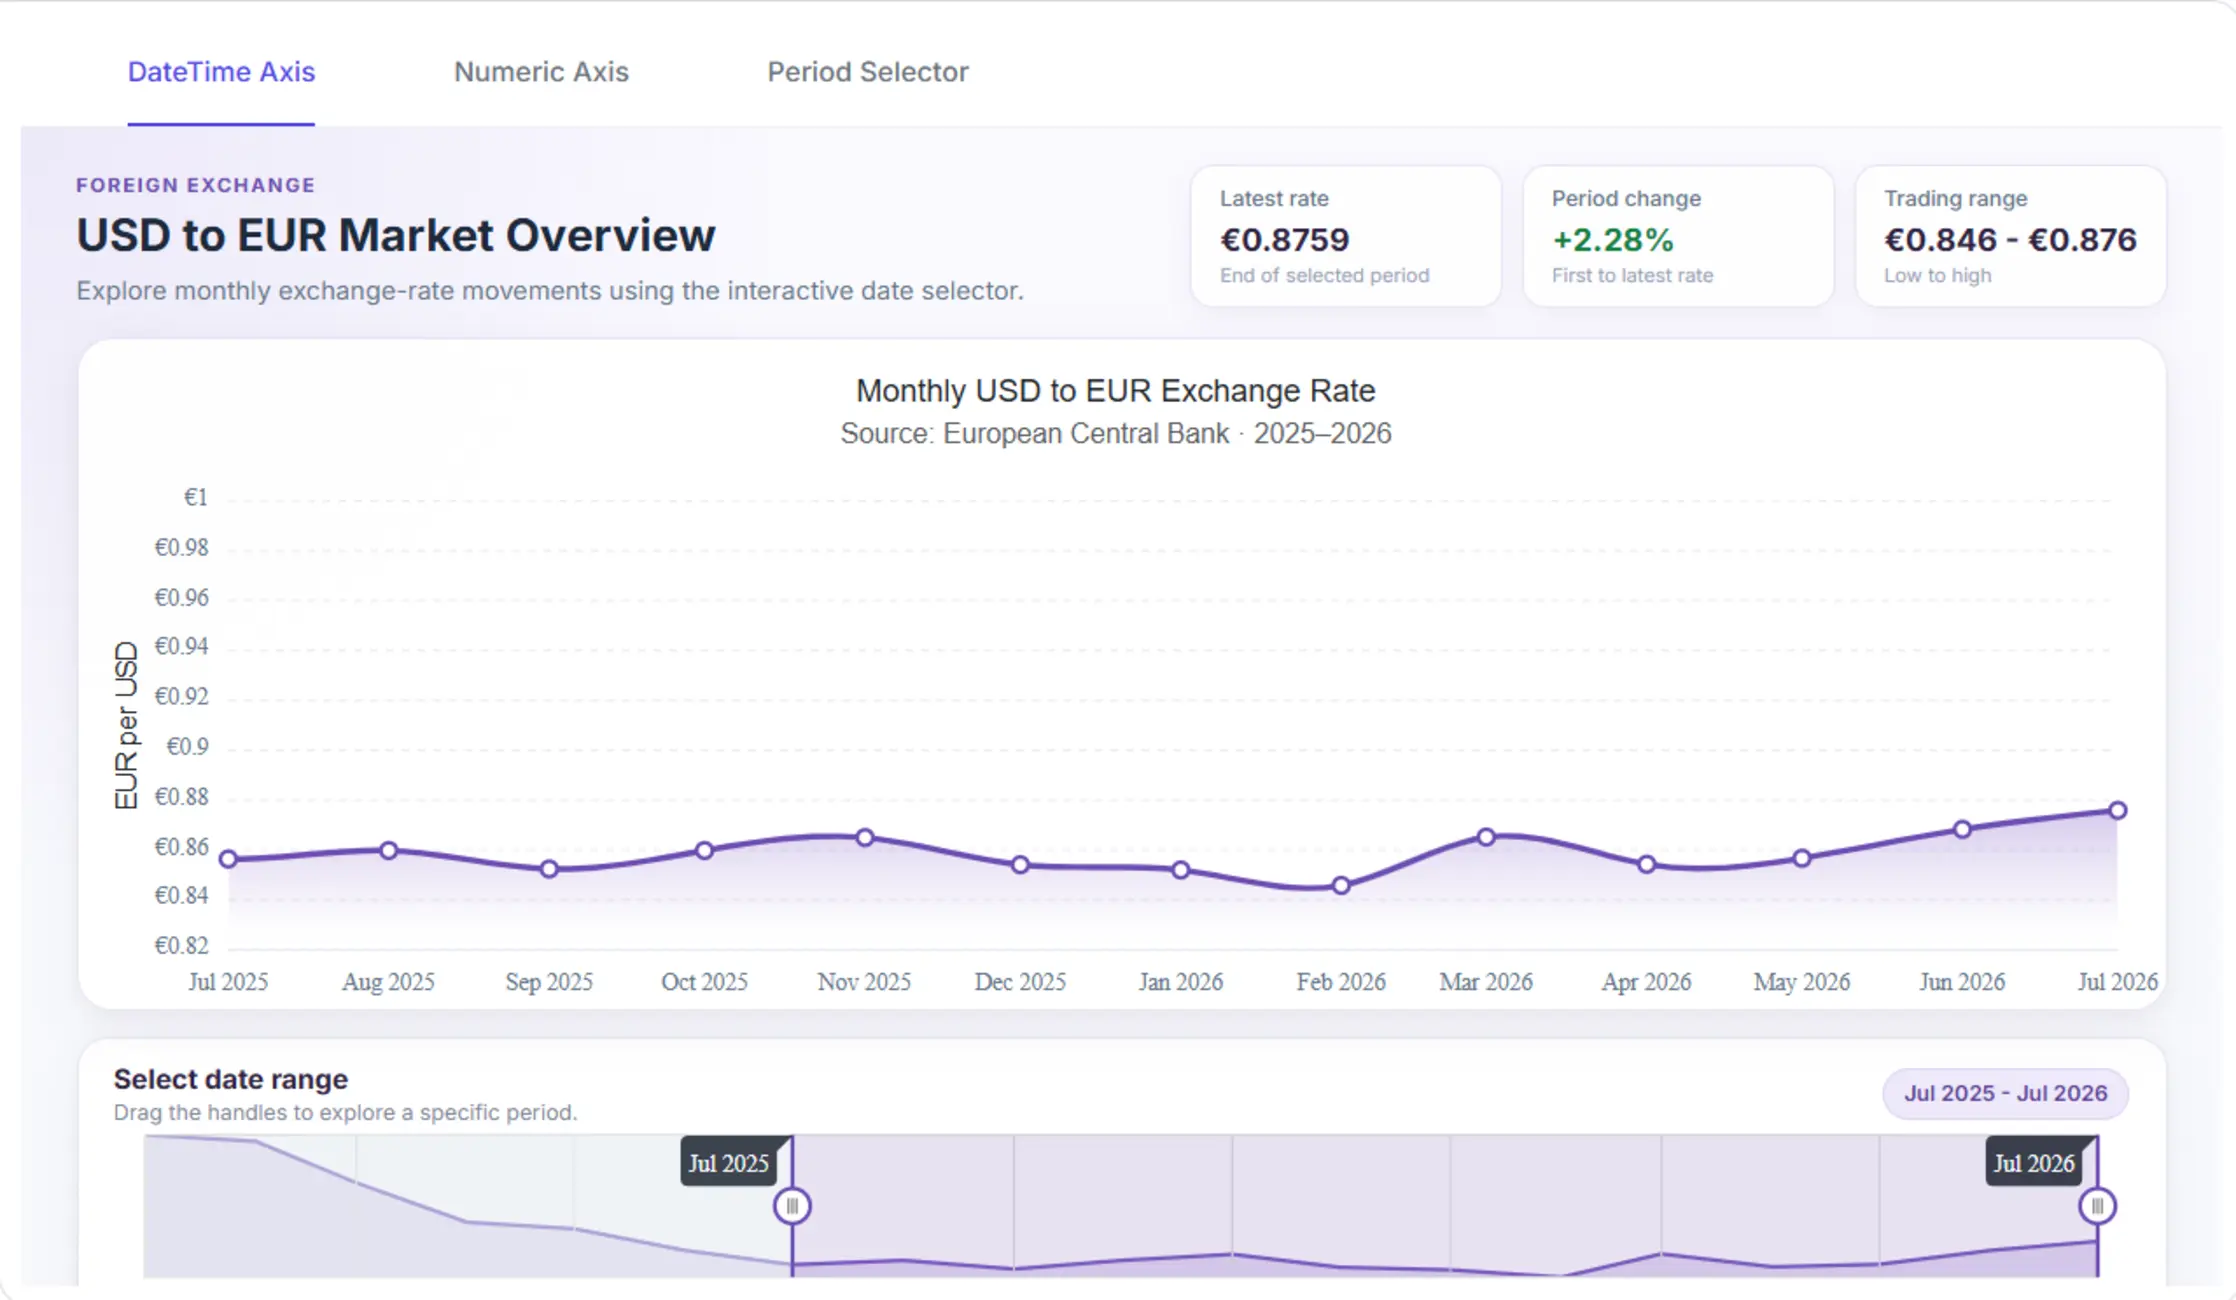
Choose the right filtering experience
Syncfusion Charts includes Range Selector and Period Selector components that help users navigate large datasets efficiently. Use Range Selector to focus on specific value ranges and Period Selector to switch between predefined time intervals such as days, months, quarters, or years.
Range Selector
Filter continuous data by selecting a specific value range.
Period Selector
Switch between predefined time periods such as days, months, or years.
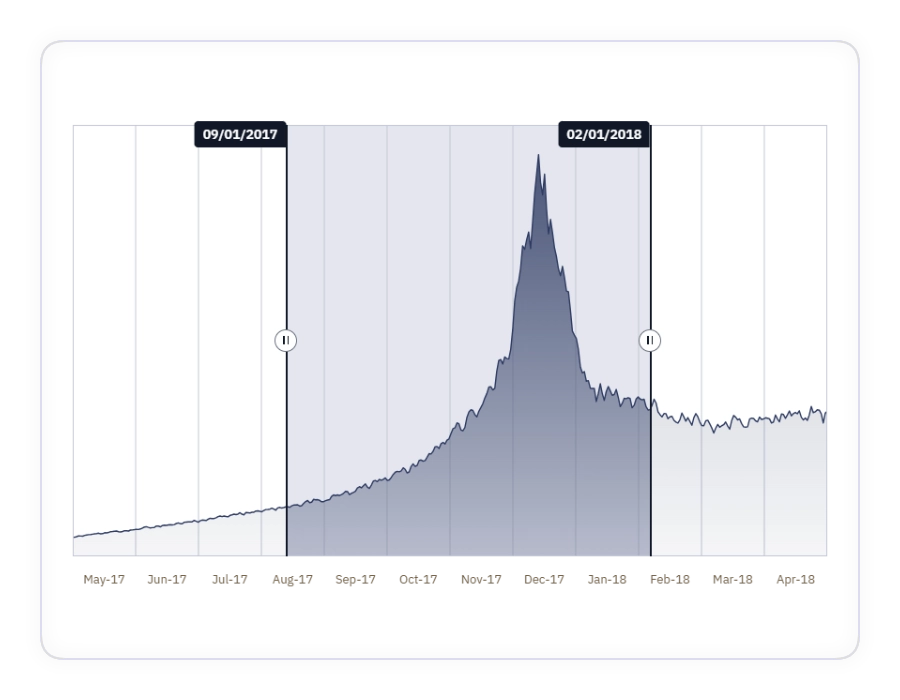
Range Selector
Allow users to interactively select and navigate a specific portion of a dataset. Use it when relevant data must be focused, since visual range selection supports continuous data without chart reloads.
- Select and filter specific value or date ranges.
- Navigate large datasets using an interactive range window.
- Connect filtered ranges with charts and visualizations.
- Combine with date or value axes for flexible filtering.
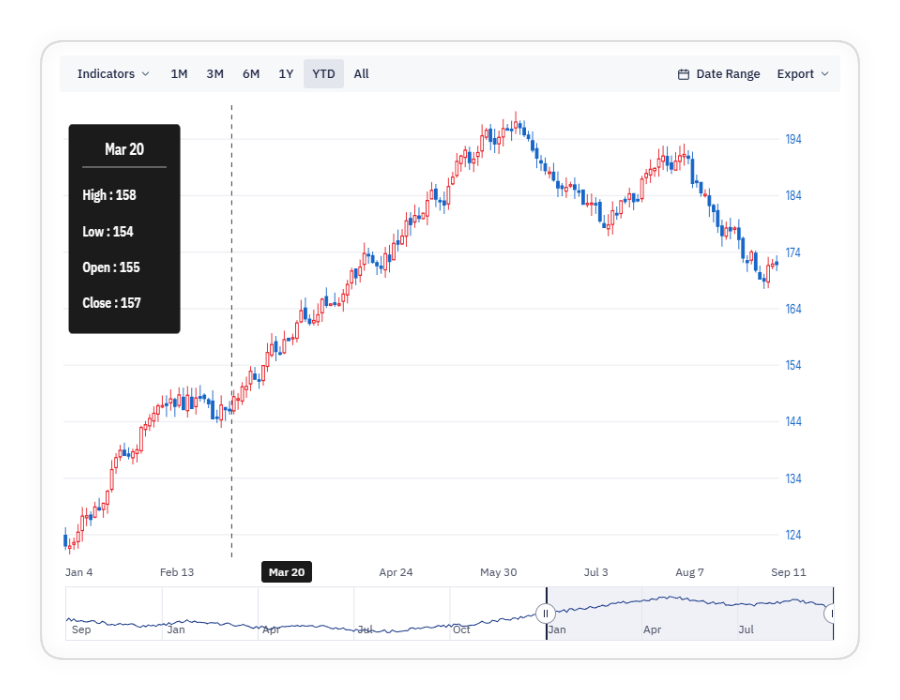
Period Selector
Filter datasets using predefined time intervals. Use it when common reporting periods are required, since predefined intervals support one month, six months, one year, year-to-date, or custom ranges.
- Switch between predefined reporting periods.
- Filter time-series data without manual range selection.
- Support trend analysis across common business timeframes.
- Define custom reporting periods beyond the built-in options.
GUIDED DATA FILTERING WORKFLOW
Apply interactive filtering in four steps
Developers can configure a Range Selector or Period Selector, bind application data, define available ranges or time intervals, and connect the selected range to charts and other visualizations.
01
Choose a selector
Select Range Selector for interactive range filtering or Period Selector for predefined time-based filtering.
02
Bind application data
Connect time-series or continuous datasets from APIs, databases, services, or analytics systems.
03
Configure ranges and periods
Define available date ranges, value ranges, or reporting intervals that users can select.
04
Filter and update visualizations
Apply the selected range or period to update charts, dashboards, and connected visualizations.
PLATFORM SUPPORT
Filter data with selectors across platforms
Core filtering and navigation components are available across web, desktop, and cross-platform frameworks, with consistent support for Range Selector and Period Selector capabilities.
| Capability | JS, React, Angular, Vue | Blazor | ASP.NET Core & MVC | WPF & WinForms | .NET MAUI | Flutter |
|---|---|---|---|---|---|---|
| Range Selector | ||||||
| Period Selector | ||||||
| Value range selection | ||||||
| Predefined time period selection | ||||||
| Yearly intervals | ||||||
| Monthly intervals |
Frequently Asked Questions
What filtering components are available in Syncfusion Charts?
Syncfusion Charts includes Range Selector and Period Selector components for filtering and navigating datasets. These components help users focus on relevant data ranges and reporting periods within interactive visualizations.
What types of applications commonly use Range Selector?
Range Selector is frequently used in financial charting applications, stock market dashboards, telemetry systems, industrial monitoring solutions, and analytics platforms that manage large time-series datasets.
Can selectors be connected to other charts and visualizations?
Yes. Range Selector and Period Selector can be linked to charts and visualizations so that the selected range or period dynamically updates the displayed dataset.
How do teams choose between Range Selector and Period Selector?
Use Range Selector when users need precise control over a specific value or date range. Use Period Selector when users frequently switch between predefined intervals such as one month, six months, one year, or year-to-date.
What types of applications commonly use Period Selector?
Period Selector is commonly used in executive dashboards, reporting systems, business intelligence portals, financial applications, and trend-analysis solutions where users analyze data across recurring reporting periods.
Can selectors work with large datasets?
Yes. Range Selector and Period Selector are designed to help users navigate and analyze large datasets by narrowing the visible data to a relevant range or period.
Resources
Learn more about our Range and Period Selector
Explore demos, KB articles, and documentation to get the most out of Range Selector and Period Selector.
Explore guides, APIs, and quick-start tips
See live use cases in action
Ask, share, and connect with peers
Find solutions and best practices fast
Get expert help when you need it
Feature requests and bug reports
Track issues and suggest improvements
Awards
Greatness—it’s one thing to say you have it, but it means more when others recognize it. Syncfusion® is proud to hold the following industry awards.