Trusted by the world’s leading companies

Overview
The JavaScript Report Viewer is a jQuery based web reporting tool that displays SSRS, RDL, and RDLC reports within web applications. It empowers your application with all major capabilities of RDL reporting such as parameters, variables, expressions, code modules, calculated fields, sorting, grouping, filtering, paging, report linking, drill down (toggle item), drill through, hyperlink and more. You can export the report to PDF, Excel, CSV, WORD, PowerPoint, and HTML formats. Reports rendered using HTML5 provide an optimal user experience across phone, tablet, and desktop form factors.
Report formats

SSRS server reports
Syncfusion HTML5 Report Viewer can render RDL reports published or deployed on SQL Server Reporting Services (SSRS) server.

Local RDL and RDLC reports
You no longer require SSRS Report Server to render RDL reports. View RDL and RDLC reports that are local or embedded in an application without using SSRS Report Server.
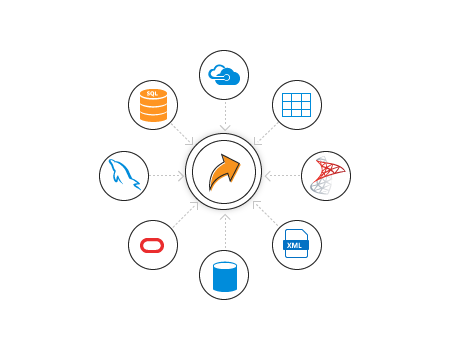
Connect to any report data source
Retrieves data from a wide variety of data sources that are in local or server data bases.
- Built-in data sources: Microsoft SQL Server, Microsoft SQL Azure, SQL CE, XML, Microsoft Access, Oracle, OLEDB, and ODBC.
- Business object data source: IList, DataSet, and DataTable.
- Custom data processing extension: MySQL, SQLite, PostgreSQL, etc.
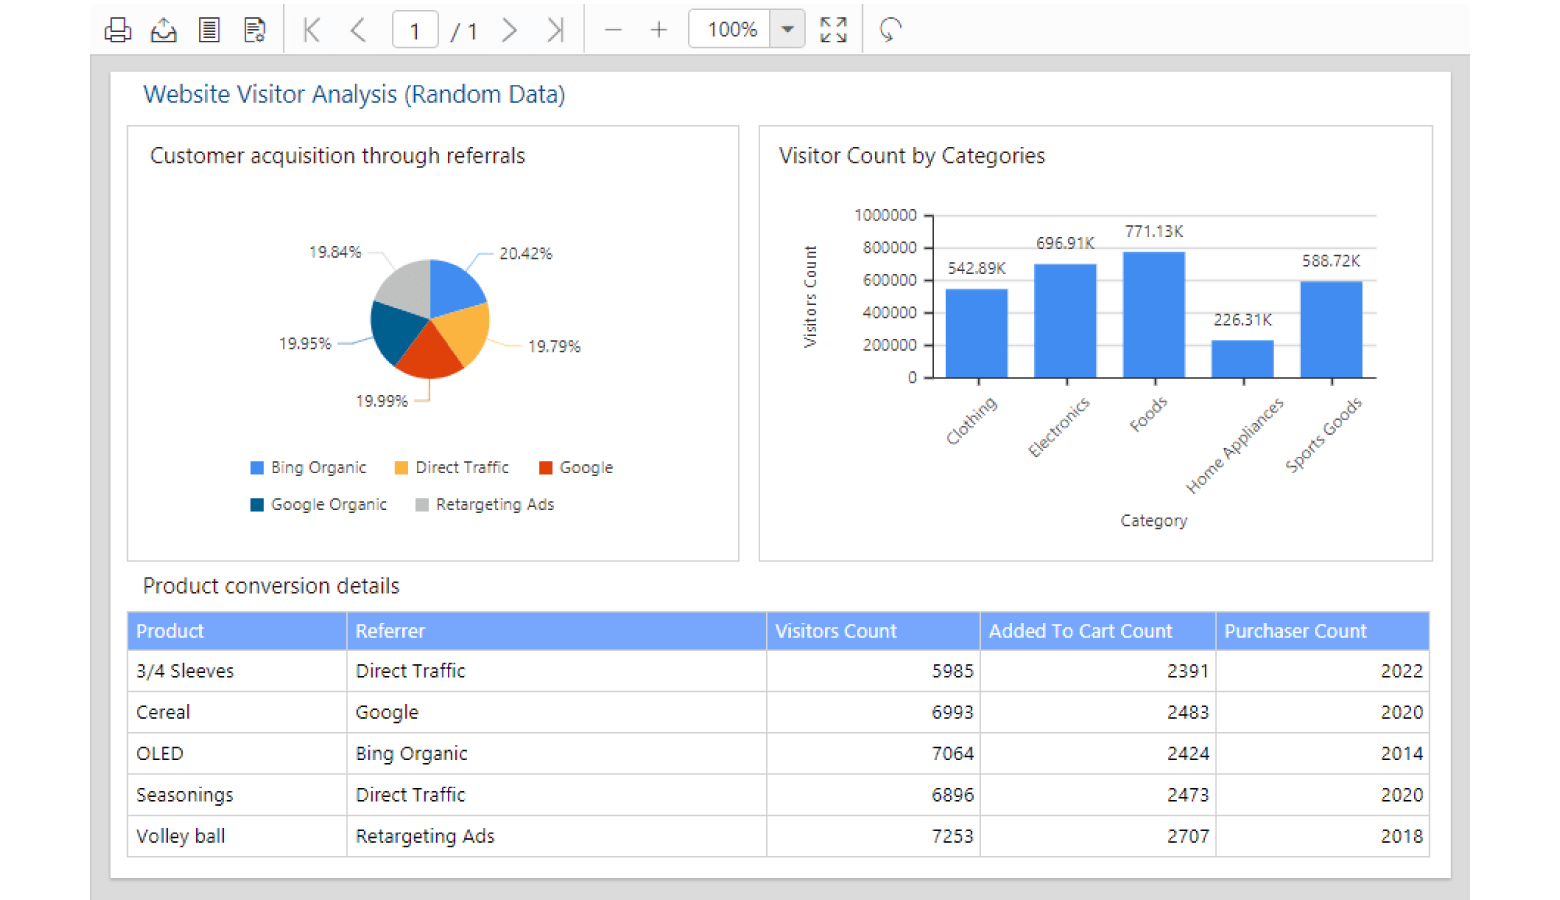
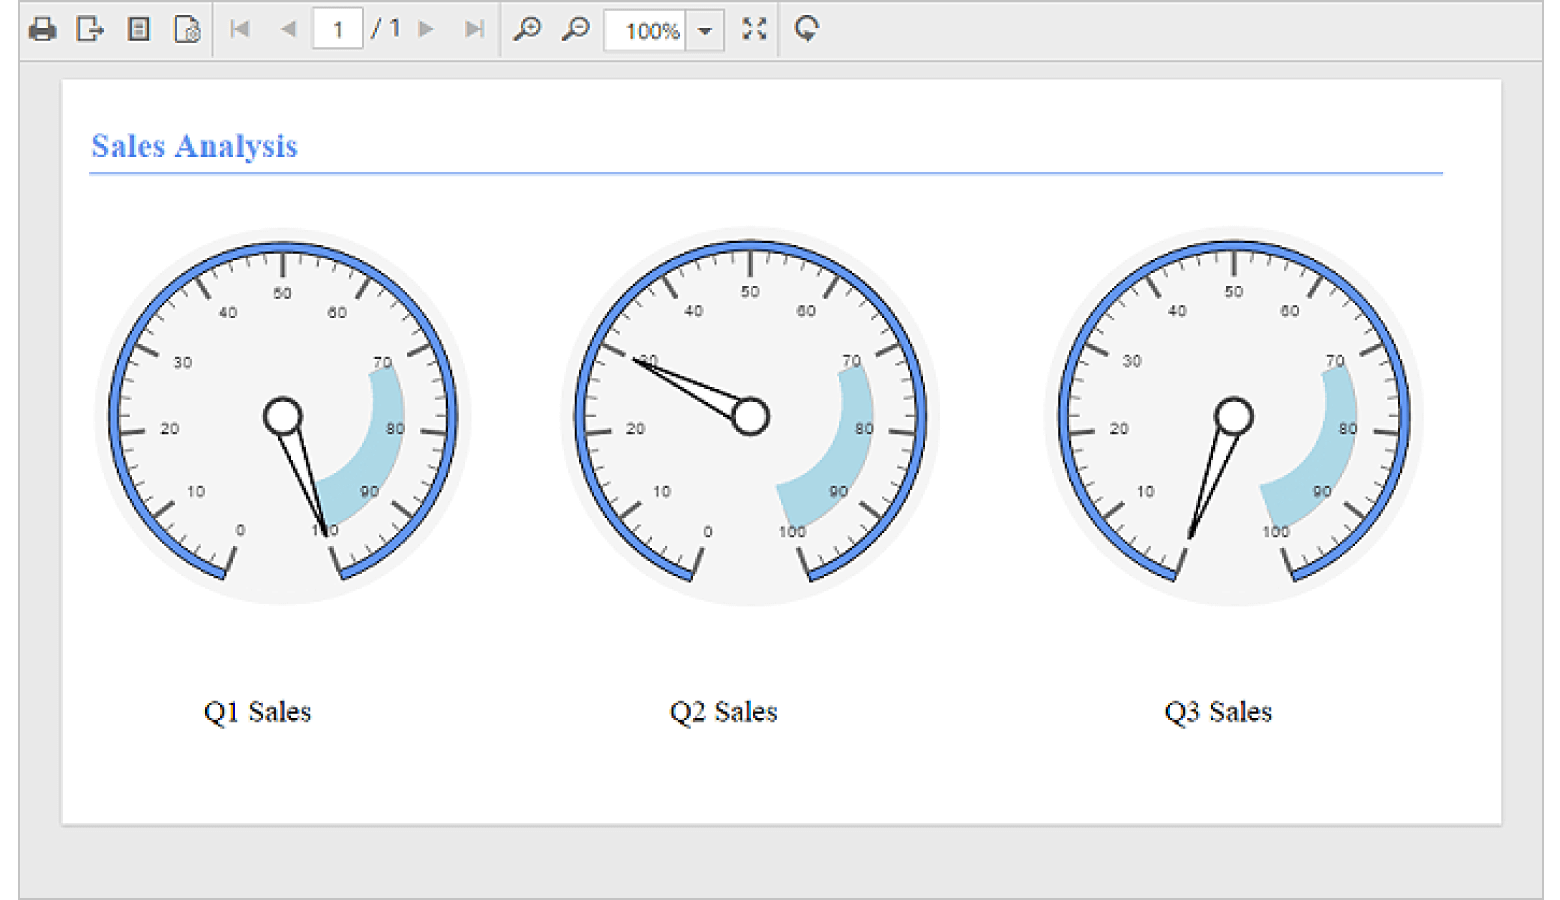
Report items
Enables users to view stylish and interactive reports created with RDL reporting standard data visualization, data region, and reports basic items efficiently:
- Basic items: Text box, image, line, and rectangle.
- Data region items: Table, matrix (pivot table) and list.
- Data visualization: Charts, sparklines, databars, gauges, indicators, and maps.
- Subreports.
- Custom report items.


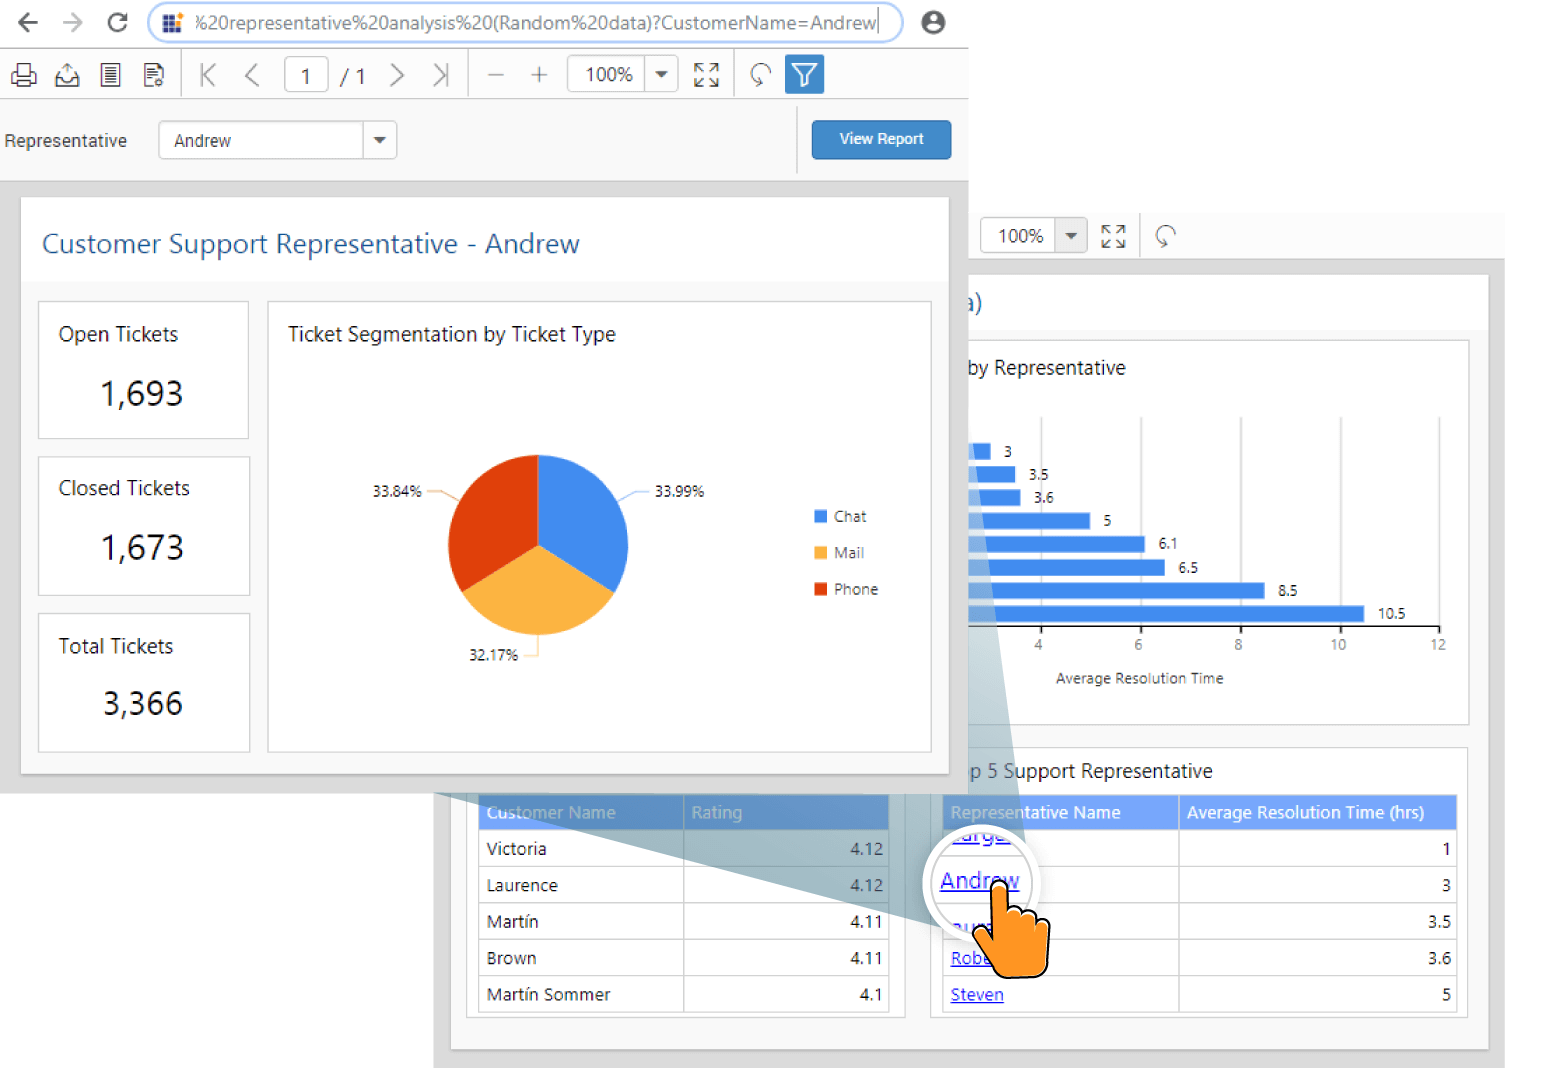
Report parameters
End users can interactively provide report parameter inputs at run-time to modify data presentation of reports based on it.

Custom parameter layout
Supports SQL Server 2016 parameter layout that enables you to render report parameters the way you want.

Query parameters
Has support to preview report with query parameters that filters data from the data source. It limits the amount of data based on the run-time parameter user input or allows it to be set in report as default values.
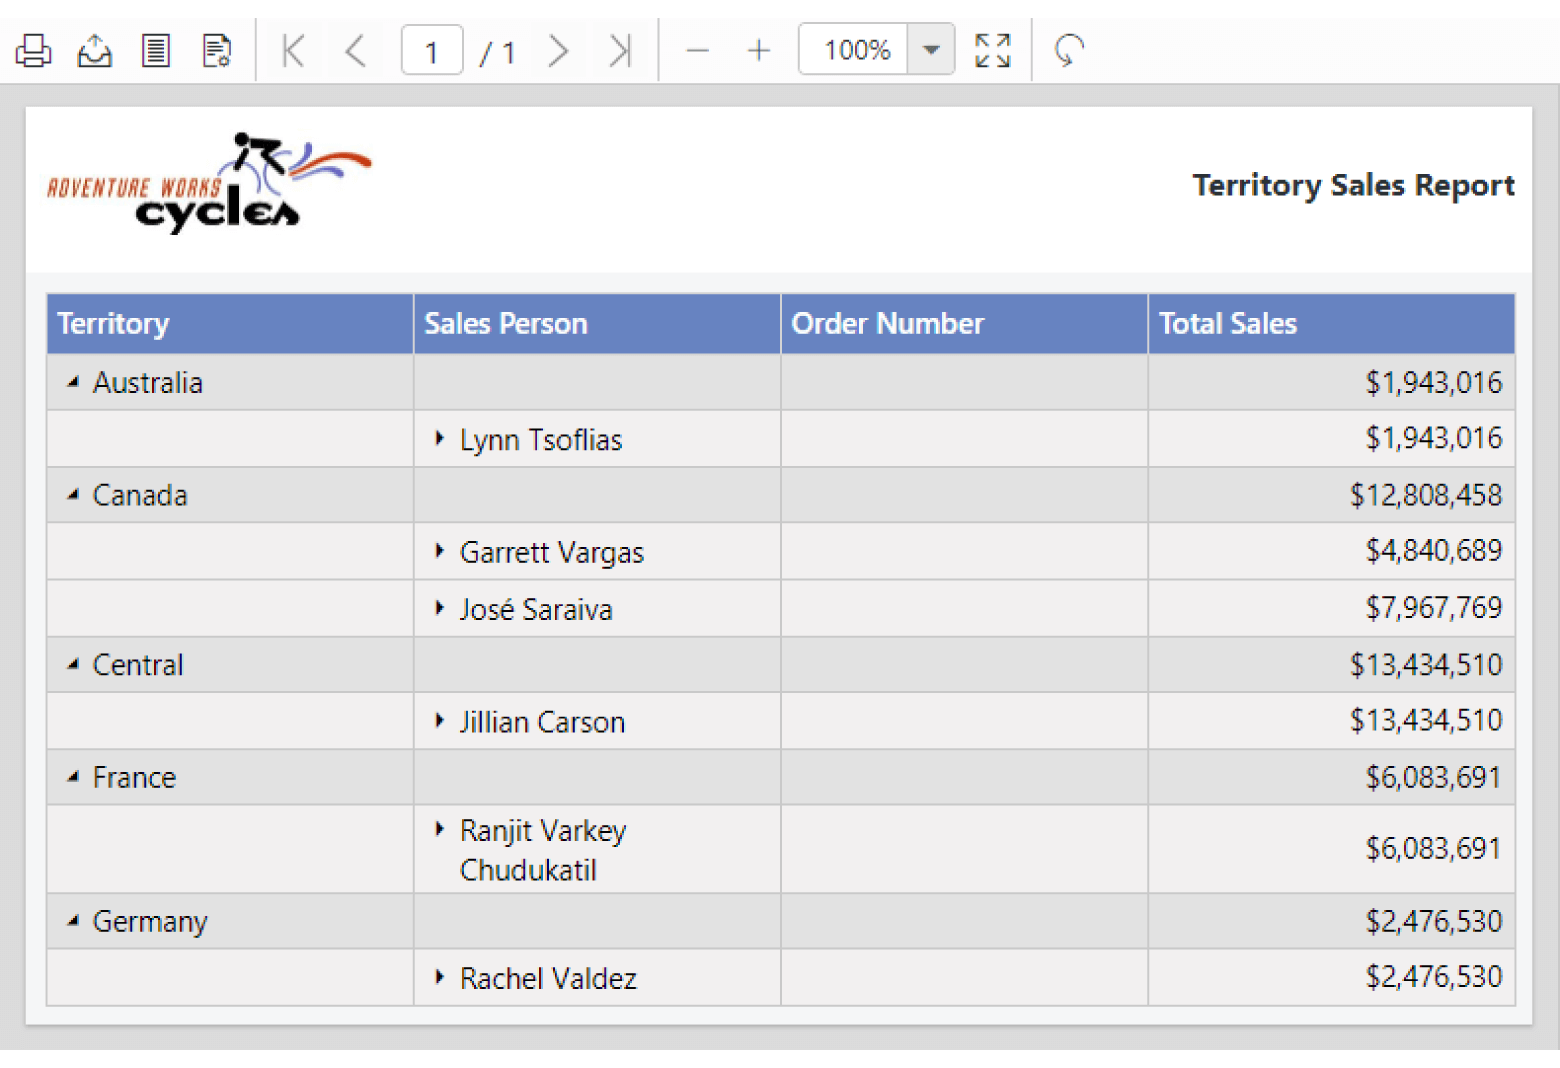
Filter, group, and sort data
Data values of data region report items are organized using grouping, sorting, and filtering. It supports items such as tables, pivot tables, lists, charts, spark lines, data bars, gauges, indicators, and maps.

Grouping
Supports grouping to visualize data in an organized way. Groups data in tables, charts, gauges, maps and indicators, and organizes data based on a dataset field, group expression, or other values.

Sorting
Controls the order in which data is displayed in a data region item of the report (either as ascending or descending).

Filtering
Filtering allows data compaction. Renders report with filters that are applied to shared or embedded data set, table, chart, or data region group.

Expressions
Renders reports with simple and complex SQL Server Reporting RDL specification expressions that specify or calculate values for report item properties, parameters, queries, groups, sorting, code module, filters, fields, collections, functions, etc.
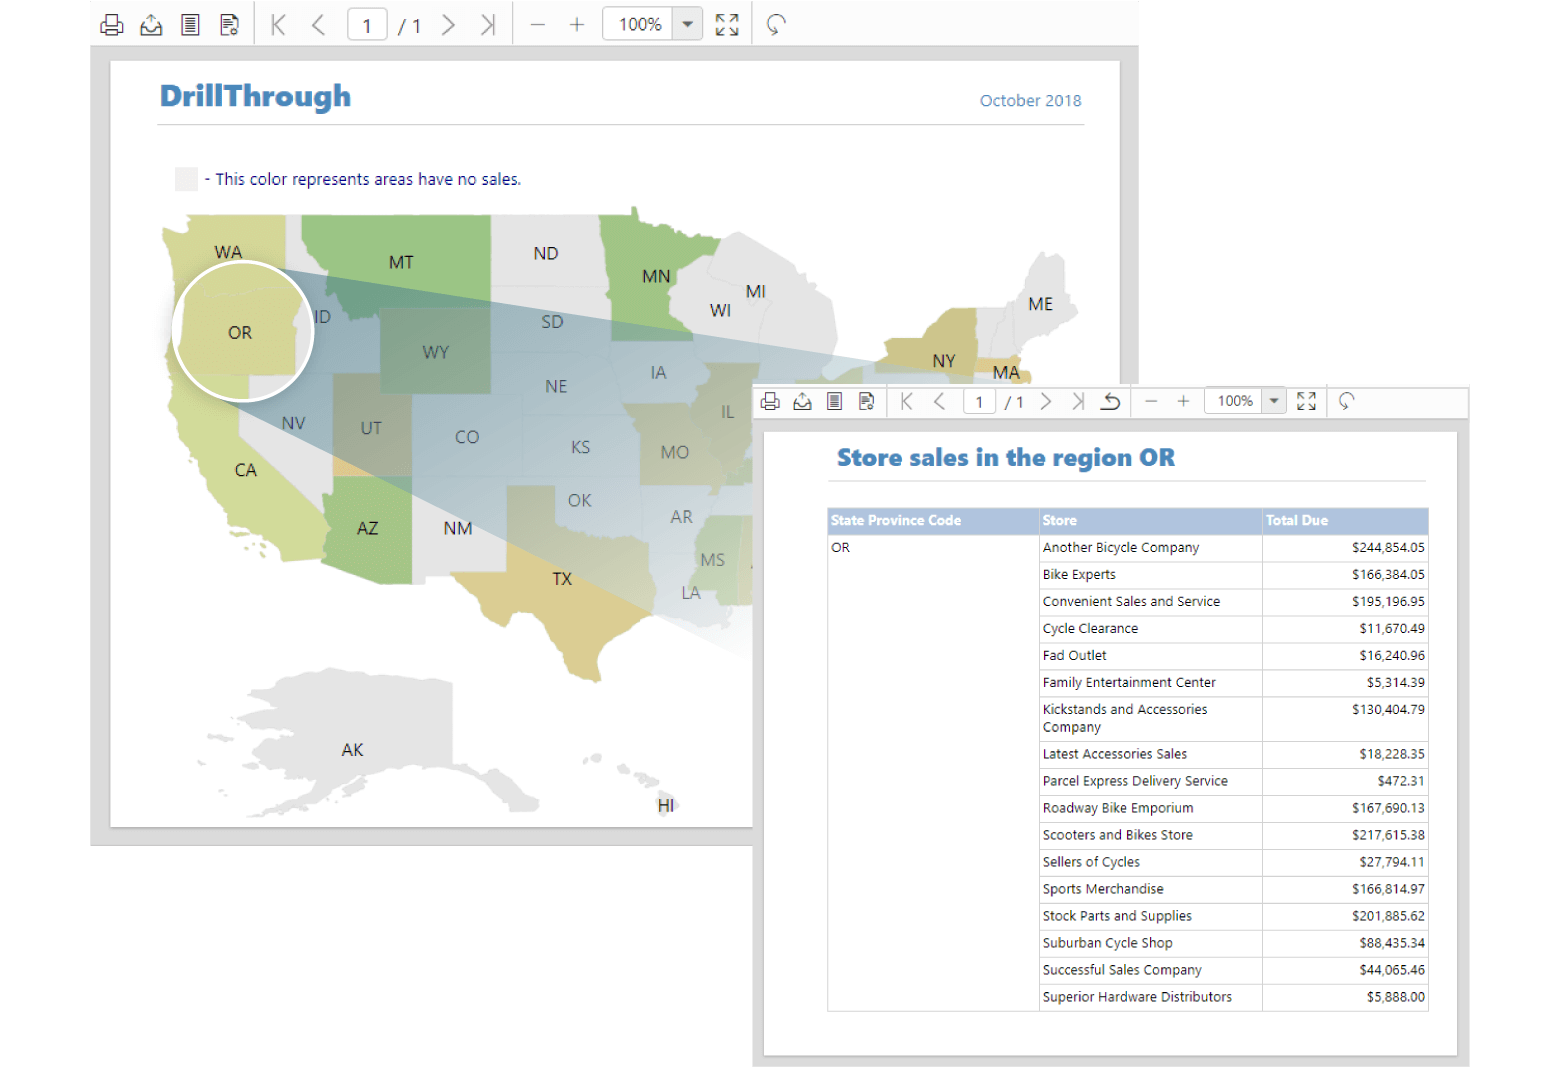
Drill through, drill down, interactive sort, and hyperlink
You can work with reports at run-time through RDL reporting features like drill through, drill down, hyperlink, and interactive sorting.
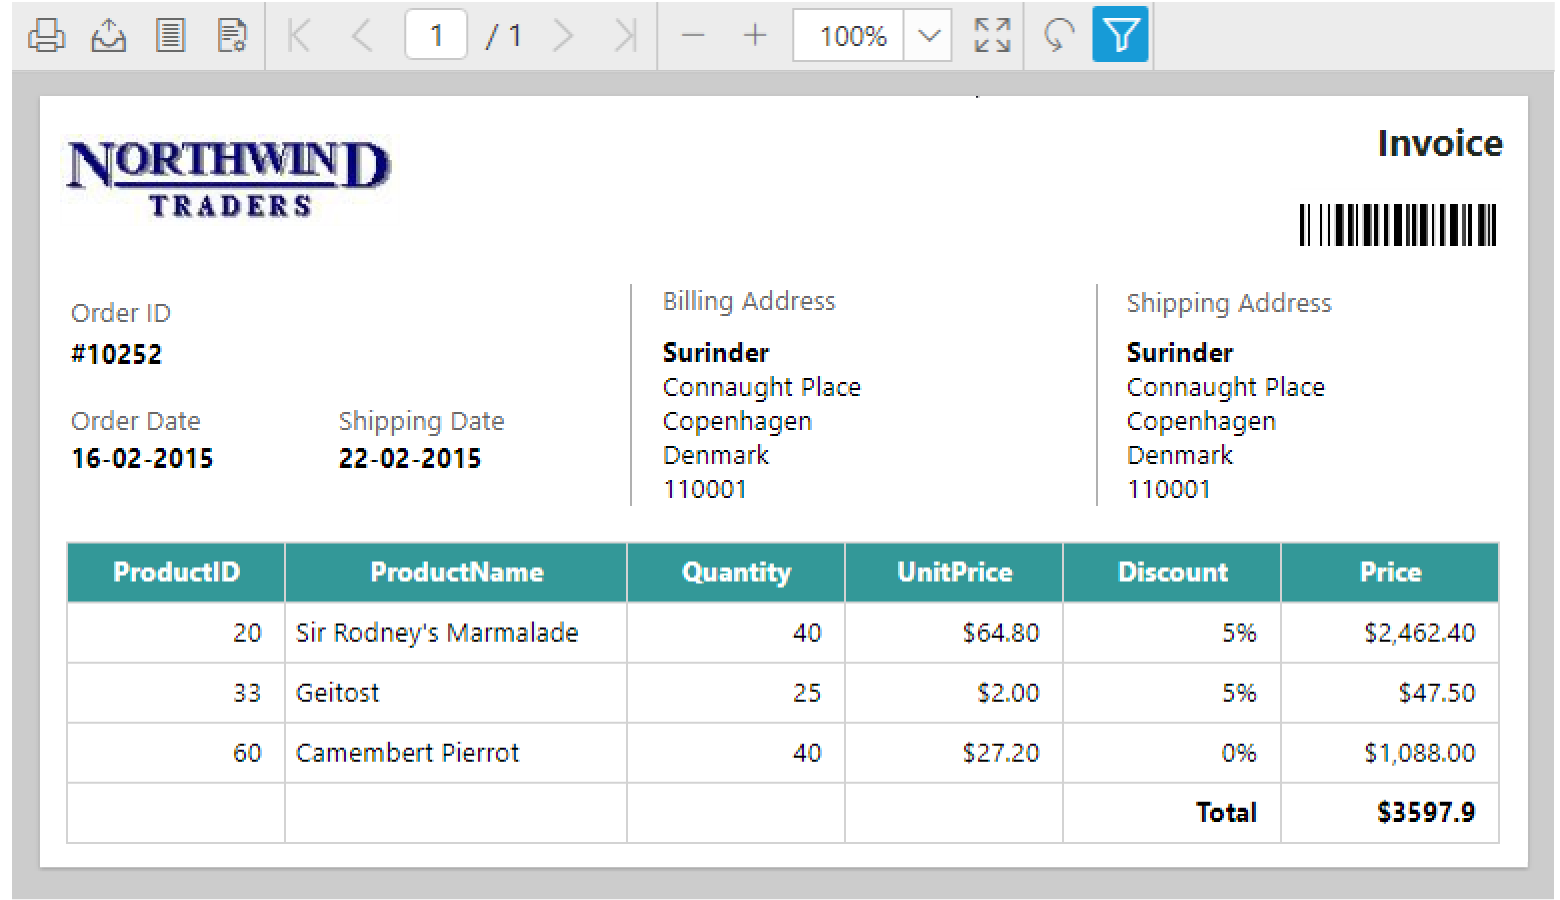
Print and export

Export RDL and RDLC reports
Export displayed reports into popular file formats such as PDF, Word, Excel, CSV, PowerPoint, and HTML. In addition, provides property options to change the export format version and settings.

Supports printing previewed reports by clicking the print option from the toolbar. Property settings allows you to view and print from the same tab or a new tab.

Print preview
Clicking print layout option on the toolbar shows the report in printable output format.

Fit to page
Options are available to fit the page content relative to the control size by page width or whole page size.

Page setup
Customize your report page design by selecting options like paper size, orientation, and margins in the Page Setup dialog. Clicking print preview option shows the changes applied to the report page in Report Viewer.

Customize toolbar
Customize toolbar icons and element’s appearances using templates. Hide the component toolbar design and show customized user interface using Report Viewer properties.

Custom parameter block
Supports customizing the default left-to-right parameter block’s appearance using templates. Hide default Report Viewer parameter block and show custom user interface.

Developer-friendly APIs
You have control over all UI elements (toolbar, parameter block, page, and dialogs) and behaviors of the HTML5 JavaScript Report Viewer. You can provide the best experience to your end users through a rich set of developer-friendly APIs.

Other supported frameworks
The HTML5 JavaScript Report Viewer supports jQuery, Angular, React, EmberJS, Aurelia, PHP, and JSP. This allows you to create your own application with web reporting features.
Globalization and localization

Globalization
You can format the report contents to any language that will help users from different locales.

Localization
Users can localize all static text of the HTML5 JavaScript Report Viewer to any preferred language.

Responsive rendering
HTML5 Report Viewer will adaptively render itself with optimal user interfaces for phone, tablet, or desktop form factors. This helps your application to scale elegantly on all form factors with ease.

Browser compatibility
Works in all modern browsers on all devices as the JavaScript Report Viewer is rendered using HTML5 elements.

Themes
The HTML5 JavaScript Report Viewer is shipped with themes such as Material, Bootstrap, Fabric (Office 365), high contrast, and more. Users can create new themes to have their own desired look and feel by using the Theme Studio application with ease.
75+ jQuery UI WIDGETS
ALL WIDGETS
GRIDS
DATA VISUALIZATION
EDITORS
NAVIGATION
NOTIFICATION
FRAMEWORK
MISCELLANEOUS
BUSINESS INTELLIGENCE
REPORTING
FILE FORMAT LIBRARY
Media
Our Customers Love Us
Having an excellent set of tools and a great support team, Syncfusion® reduces customers’ development time.Here are some of their experiences.

We're using the file formats and Windows/JavaScript list controls a lot. They're fast, easy to use, and the documentation is good and contains examples. Tickets with questions or suggestions were answered within a day, so we're happy to use the Syncfusion libraries.
Using Syncfusion Angular and JavaScript controls makes front-end web development a piece of cake. Each component has many properties that can be configured as per your desire, methods that can be used to interact with the element, and a lot of events that trigger at different stages, which makes modifying your components according to the state of the application an easy task. Also, their support is amazing! They always offer a sample working project, which makes it very simple to solve your question about your code.
Rated by users across the globe
Syncfusion jQuery Resources
Learning
 Documentation
 Documentation


Awards
Greatness—it’s one thing to say you have it, but it means more when others recognize it. Syncfusion® is proud to hold the following industry awards.

