
Task scheduling is a complex task and is mandatory to improve productivity. It depends on many factors, like resource availability, task deadlines, and one task’s dependency on others being completed. To effectively handle task scheduling, you need a powerful tool to handle the sequence and timeframes of tasks.
The Syncfusion Blazor Gantt Chart is a project management tool. It provides a Microsoft Project-like interface for scheduling and managing projects in a Blazor application. Its intuitive user interface lets you visually manage tasks, resources, and task relationships in a project.
In this blog, we will see how to use the task scheduling and markers features in the Blazor Gantt Chart to perfectly schedule and manage your tasks.
Task scheduling
Using a Gantt chart is like putting a bridge between your initial project plan and the execution level. With the Gantt charts, you can set reasonable deadlines to finish a project.
You can use the Blazor Gantt chart to schedule tasks that need to be done on a specific day. It also displays the start and end dates of a project in one simple view along with the progress made. Apart from the individual task progress, you can also have a look at the overall progress made in the parent task using our Blazor Gantt Chart.
Scheduling modes
The Syncfusion Blazor Gantt Chart supports the following scheduling modes:
Auto scheduling
In the auto scheduling mode, the Blazor Gantt Charts validate and schedule the tasks based on their start and end date values. These validations are based on the child tasks with various factors like duration, holidays, weekends, and predecessors.
This auto scheduling mode helps avoid excess planning time for a task. Let’s see some examples to have a clear picture of this mode.
Example 1:
new TaskData() {
            TaskId = 5,
            TaskName = "Project estimation",
            StartDate = new DateTime(2019, 03, 29),
            EndDate = new DateTime(2019, 04, 2),
            Duration="4"
        }
Here, the EndDate value in dataSource is on April 2, 2019. But the taskbar renders up to April 3, 2019, since the duration is set to four days. The Gantt Chart considers the weekends ( Saturday and Sunday) as nonworking days. So, the end date is auto validated to April 3, 2019.
Note: You can also customize the weekend days.
Example 2:
new TaskData() {
            TaskId = 1,
            TaskName = "Project initiation",
            StartDate = new DateTime(2019, 03, 28),
            EndDate = new DateTime(2019, 07, 28),  // Here, this is the end of parent record,
            Duration="4"
        },
        new TaskData() {
            TaskId = 2,
            TaskName = "Identify Site location",
            StartDate = new DateTime(2019, 03, 29),
            Progress = 30,
            ParentId = 1,
            Duration="2" // Child record duration.
        },
        new TaskData() {
            TaskId = 3,
            TaskName = "Perform soil test",
            StartDate = new DateTime(2019, 03, 29),
            ParentId = 1,
            Duration="4" // Child record duration.
        },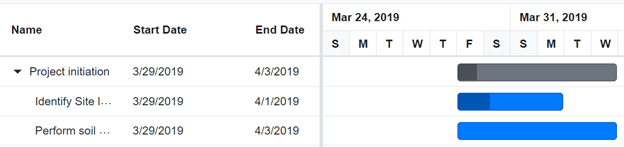
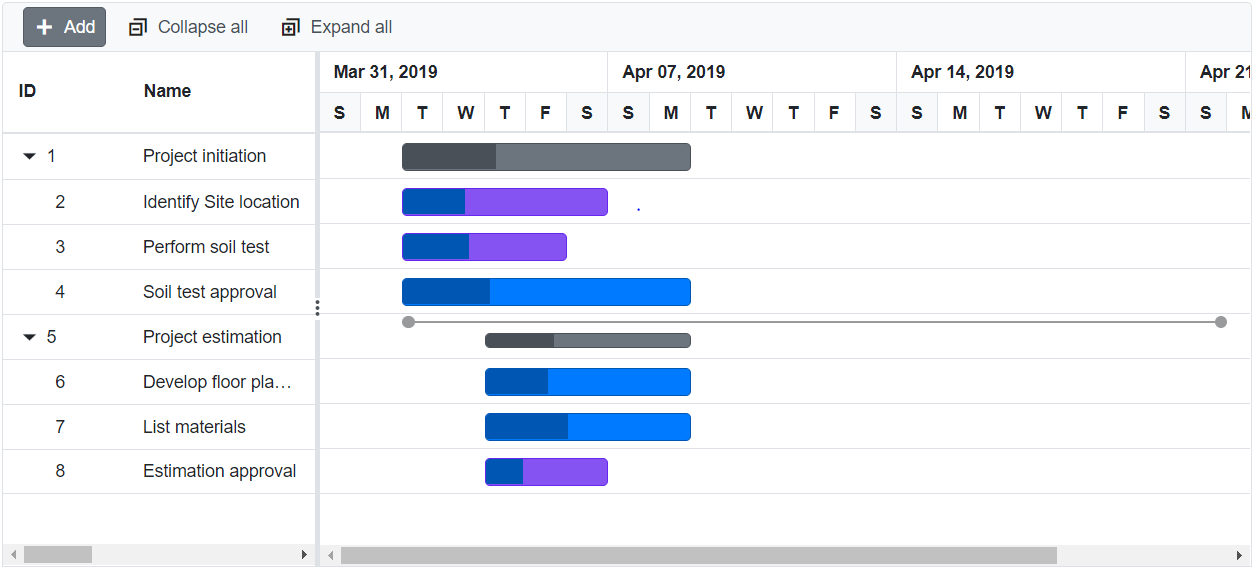
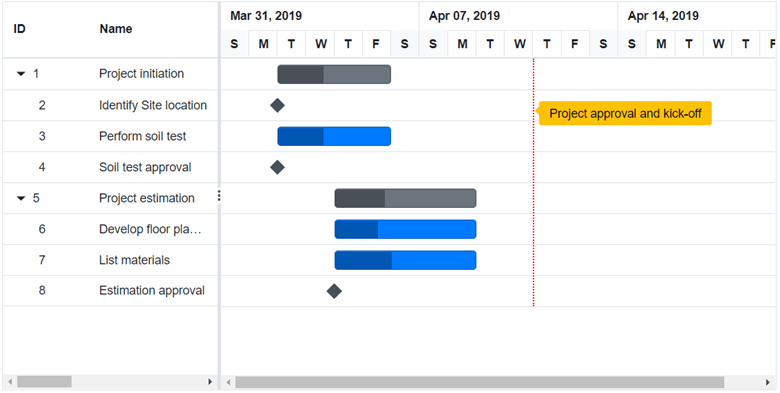
In this example, the end date value of the parent record is July 28, 2019. Yet, the Blazor Gantt Chart renders the parent row’s taskbar only up to April 3, 2019. This is because the parent row duration is auto validated considering its child records duration. The maximum end date for its child record is April 3 and so the parent record is auto validated to April 3, 2019. Similarly, the start date of the parent task is auto validated to March 29 based on the start date of its children.
Manual scheduling
Although the Blazor Gantt Chart provides an option to auto validate tasks to optimize their scheduling, you can also manually schedule tasks. This helps to schedule dates as planned by the project managers without any optimizations or validations.
Let’s see an example.
new TaskData() {
            TaskId = 1,
            TaskName = "Project initiation",
            StartDate = new DateTime(2019, 03, 28),
            Duration="4"
        },
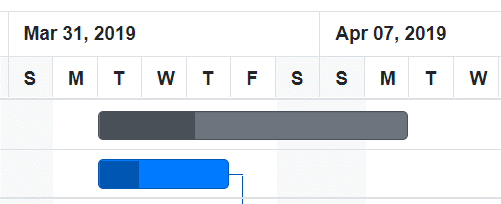
Here, the parent record’s start date is March 28, 2019, and the duration is four days in the data source.
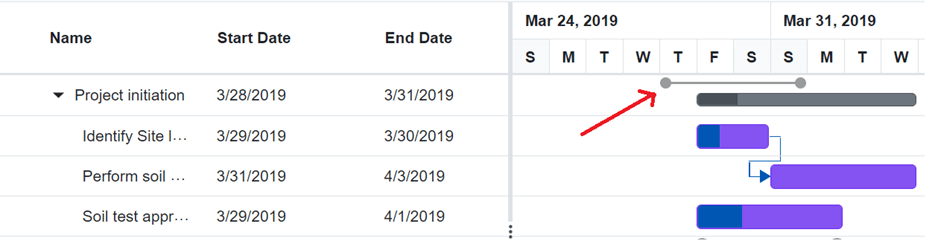
The baseline taskbar, drawn in grey color (where the red arrow points), is rendered with values as it is in the data source (March 28, 2019 and March 31, 2019 ) without any validation. It does not consider the weekends, holidays, and child tasks.
In manual mode, the auto validated taskbar is also rendered below the manually scheduled baseline taskbar (between March 29, 2019 and April 3, 2019).
Custom scheduling
The custom scheduling mode is a combination of both auto and manual scheduling modes. We can specify which records need to be auto validated and which are to be manually scheduled.
Note: For more details, refer to the Example of Scheduling Mode in Blazor Gantt Chart Component demo.
Unscheduled tasks
Also, you can include the unscheduled tasks of a project without any definite schedule dates in our Blazor Gantt Chart. You can create or update these tasks by partially rendering the taskbar with any one of the specifics: start date, end date, duration, or none.
Refer to the following screenshot.
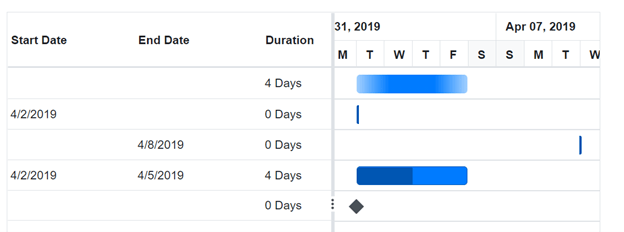
In the previous image:
- The first record has no start or end date. It has only a duration value.
- The second record has only a start date.
- The third record has only an end date.
- The fourth record is a scheduled task, as it has a start date, end date, and duration.
- The fifth record has no start date, end date, or duration. So, it is marked as a milestone.
Note: For more details, refer to the Example of Unscheduled Tasks in the Blazor Gantt Chart Component demo.
Baseline
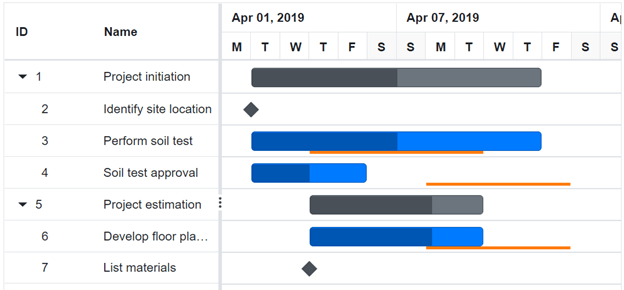
The baseline scheduling mode enables users to view the deviation between the planned and actual dates of a project. This feature is beneficial when we need to act quickly for project deviations. We have to provide the deviation values along with the data source. Then, the Blazor Gantt Chart will provide a UI representation for the deviations below the main taskbar.
Refer to the following code example.
new TaskData() {
                    TaskId = 3,
                    TaskName = "Perform soil test",
                    StartDate = new DateTime(2019, 04, 02),
                    BaselineStartDate = new DateTime(2019, 04, 04),
                    BaselineEndDate = new DateTime(2019, 04, 09),
                    Duration = "8",
                    Progress = 50
                },
Note: For more details, refer to the Example of Baseline in Blazor Gantt Chart Component demo.
Markers
In a complex project or resource planning chart, one may need to highlight some key events, deadlines, or reference points for better understanding.
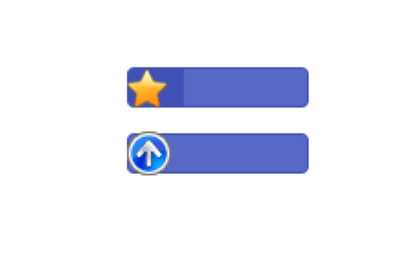
You can achieve this using markers in our Blazor Gantt Chart. Use these indicators to highlight tasks, specific dates, and whatever you want in the Gannt Chart timeline.
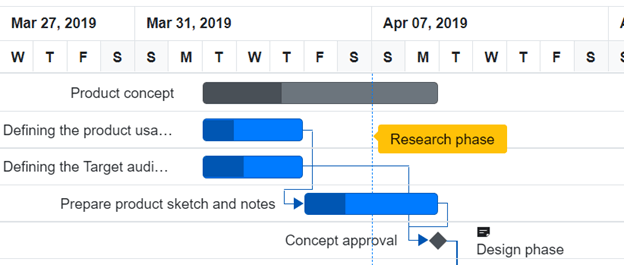
In the previous image, Research Phase is a marker that denotes analysis of the product that needs to be completed within that timeline.
Types of markers
The types of markers available in the Blazor Gantt Chart are:
Event markers
The event marker is shown by drawing a vertical line on a timeline to highlight that time for all the tasks in a project. You can use this to highlight the important events in a project.
Note: For more details, refer to the Example of Event Markers in the Blazor Gantt Chart Component demo.
Data markers
The data marker helps to display additional information with indicators like a tooltip along with the regular taskbar. You can use this to display events for a specific task on the timeline on any given date. Also, you can represent more than one data marker in a task.
Holidays
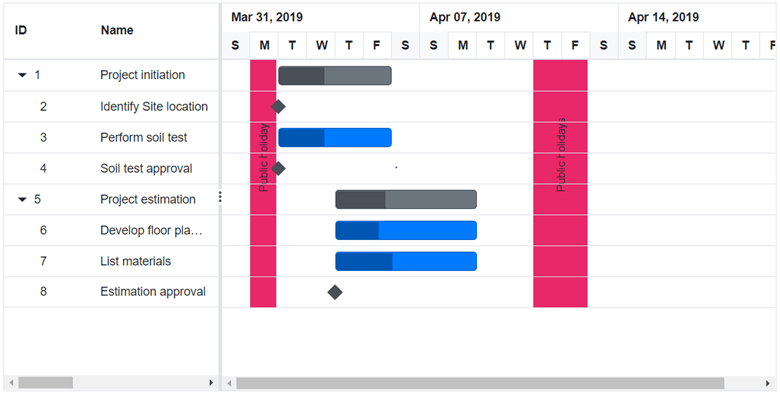
Different localities have different nonworking days. The Gantt Chart provides support to map the nonworking days on a project timeline. You can easily schedule tasks for the working days alone in your Blazor app. It is also possible to customize the weekend holidays in the timeline.
Refer to the following screenshot.
Note: For more details, refer to the Example of Holidays in the Blazor Gantt Chart Component demo.
GitHub reference
Also, you can download the entire project setup for the Blazor Gantt Chart on GitHub.
Conclusion
Thanks for reading! In this blog post, we have seen how the task scheduling and markers features in the Blazor Gantt Chart help us elegantly schedule our projects. You can use the sample uploaded here for more references. The Blazor Gantt Chart’s rich feature set includes data binding, task relationships, filtering, globalization, localization, and more. Use them to schedule your tasks like a pro in a Blazor app!
Our Gantt Chart is also available in our Blazor, ASP.NET ( Core, MVC, and Web Forms), JavaScript, Angular, React, Vue, WPF, and UWP platforms. Try out them and enhance your productivity!
If you have any queries, please let us know in the comments section below. You can also contact us through our support forums, Direct-Trac, or feedback portal. We are always happy to assist you!


 No spam, just valuable updates.