

Gantt chart: What is it?
A Gantt chart is an effective data visualization tool to manage events, resources, and timelines in projects. Professionals use Gantt charts to plan, schedule, assign, and track project tasks. They help us see dependencies between tasks, where one task relies on another, or perhaps several. With this visualization, we can easily identify the critical path of a project.
Why do professionals need the Gantt chart in their projects?
A project manager should use a Gantt chart in their projects to perform the following functions:
Project planning
“Those who plan, do better than those who do not plan, even though they rarely stick to their plan.”
– Winston Churchill
A Gantt chart is used to plan a project as a number of modules and submodules in a hierarchical manner, which helps us understand the project requirements more clearly. It is also possible to manage multiple projects in a single Gantt chart.
Gantt charts help us plot all the project tasks, phases, and milestones against a schedule. You can plan estimation times, budgets, and resources for the project.
Project tracking
The Gantt chart helps you easily visualize and track the progress of each work item. The dependency tasks feature shows you any lags or leads in predecessor or successor tasks in a project. The critical path feature in a Gantt chart helps you ensure tasks are completed within the estimated time.
A milestone or event marker helps us track the completion of a list of tasks in an estimated time. This way, we can monitor the risk of a task deviating from the planned schedule.
Task management
By using a Gantt chart, we can easily create new assignments, modify existing tasks if their requirements have changed or remove planned tasks.
In a complete Gantt chart setup, users will receive an alert for new assignments and can view the list of assigned tasks with start and due dates.
Resource management
We can easily assign tasks to the available resources in the Gantt chart, which helps avoid problems like scheduling conflicts or over-allocating work. We can track the work completed by each resource every day.
Also, we can view the available resources instantly, which helps us utilize the resources with maximum efficiency.
Collaboration
Gantt charts help team members and leaders plan, coordinate, control, and monitor tasks, allowing them to collaborate on their projects from a single page. This way, everyone on the project has access to information and will be updated in real time when changes occur.
Benefits of using Gantt charts
The following list describes the common benefits of a Gantt chart in project management, and how to utilize these benefits with the Syncfusion Gantt Chart in ASP.NET Core demo.
Agility
Agile is a process by which a team can manage a project by breaking it into several small stages. It helps us iterate to continuously improve at every stage to deliver the project to the customer with maximum efficiency. The stages in a project can be easily managed in a Gantt chart with a hierarchical relationship of tasks.
Data binding support in the Syncfusion Gantt Chart creates a parent-child relationship between tasks for local and remote data.
Refer to the following code example.
<ejs-gantt id='Resources' dataSource="ViewBag.dataSource">
        <e-gantt-taskfields id="TaskId" parentID="ParentID" >
        </e-gantt-taskfields>
</ejs-gantt>
Easy-to-undersand visualization
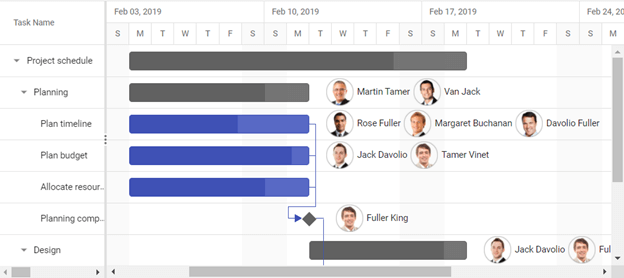
With the Gantt Chart component, you can easily track critical project information and dependent tasks with the tooltip and dependency properties, respectively. The chart area of the control clearly visualizes the progress of the project. The timeline property helps you identify each task’s scheduling.
Refer to the following code example.
<e-gantt-timelinesettings>
            <e-timelinesettings-toptier unit="Week" format="MMM dd, y"></e-timelinesettings-toptier>
            <e-timelinesettings-bottomtier unit="Day"></e-timelinesettings-bottomtier>
        </e-gantt-timelinesettings>
Clarity of communication
A Gantt chart instantly provides clear information about a task. It helps us and others working on a project to better understand how things are unfolding. This will lead to the successful completion of the project.
Let’s see how the Gantt Chart component provides information about a project with clarity with its features!
- The Dependency property of a task establishes the relationship between any two tasks.Refer to the following code example.
<ejs-gantt>
   <e-gantt-taskfields id="TaskId" dependency="Predecessor" >
   </e-gantt-taskfields>
</ejs-gantt>
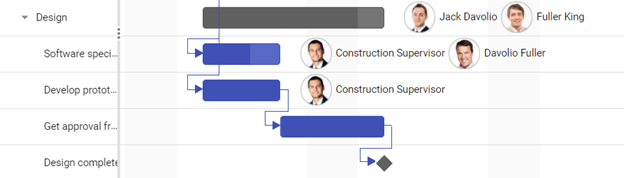
Gantt Chart Showing Dependency Tasks - The Edit dialog feature helps us categorize all the task information in tabs, which clearly delivers information about the task.
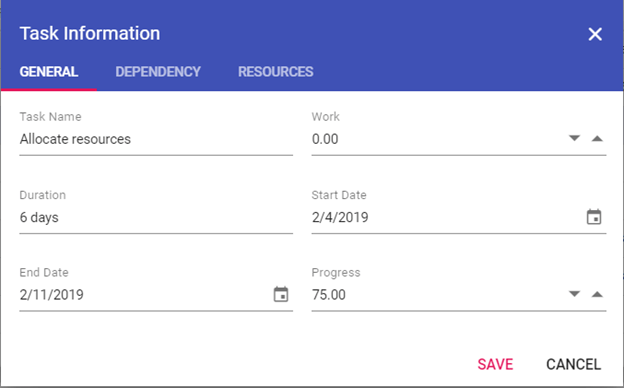
Edit Dialog in Gantt Chart
Prevent resource overloading
A Gantt chart helps you schedule work and plan project tasks appropriately. It also allows you to easily assign, redistribute, and withdraw tasks to and from the resources. This makes it possible to complete a project without requiring extra work by effectively dividing and assigning time for tasks.
Resources can be dynamically assigned to a specific task with the help of the cell editing and dialog editing features.
Refer to the following code example.
<ejs-gantt id='Resources' dataSource="ViewBag.dataSource" resources="ViewBag.projectResources">

        <e-gantt-resourcefields id="ResourceId" name="ResourceName" unit="ResourceUnit">
        </e-gantt-resourcefields>
        <e-gantt-taskfields id="TaskId" resourceInfo="Resources">
        </e-gantt-taskfields>
Better time management
Multiple projects can be scheduled in a single Gantt chart, which is one of the biggest benefits of its use in project management. Time plays an important role in the life of a project, and the Gantt chart helps project members understand the severity of any time delays.
When you have a unified view of the overall progress, you can easily allocate the appropriate time to every task and do what really needs to be done with utmost priority.
GitHub sample
You can get the sample project used in this article from this GitHub repository.
Conclusion
In this article, we have explained the benefits of using a Gantt chart in project management. We have also seen how to utilize these benefits in an ASP.NET Core project by using the Syncfusion Gantt Chart with a demo project. To learn more about the Gantt Chart component and its features, please refer to this sample browser and documentation.
Our Gantt Chart is also available in our Blazor, ASP.NET (MVC and Web Forms), JavaScript, Angular, React, Vue, WPF, and UWP platforms. Use them to enhance your productivity!
If you have any queries, please let us know in the comments section below. You can also contact us through our support forums, Direct-Trac, or feedback portal. We are always happy to assist you!
 No spam, just valuable updates.