Trusted by the world’s leading companies

Overview
The JavaScript Pivot Gauge control written in jQuery is ideal for highlighting business-critical key performance indicator (KPI) information and summary values in an intuitive manner.
Data binding
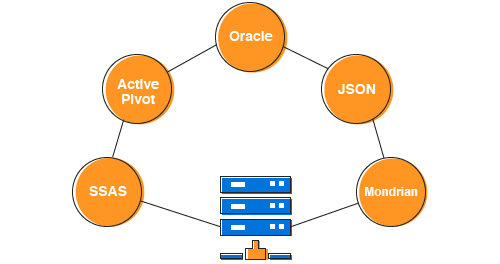
The JavaScript Pivot Gauge provides extensive support to bind OLAP and pivot data sources.
- OLAP data sources: SSAS, Mondrian, ActivePivot, and Oracle.
-
Pivot data sources: DataTable, DataView, and DataSet from SQL databases, and collections like IEnumerable, ICollection, IList, List
, and ArrayList.
Optimized for mobile devices

Touch support
All features work smoothly on desktop and tablet devices.

Responsiveness
The control’s layout can be viewed on desktop and tablet devices.
Key performance indicators
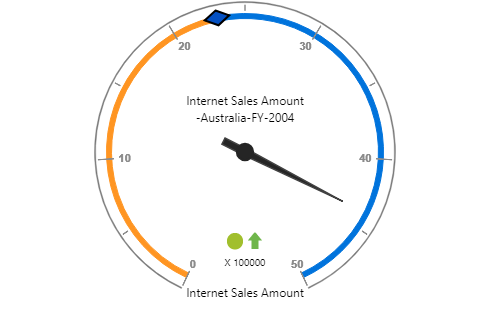
KPIs are collections of calculations associated with a measure group that evaluates business success. Typically, these calculations are a combination of multi-dimensional expressions (MDX) or calculated members. Four different types of KPI indicators are available in the Pivot Gauge control:
- Goal
- Status
- Trend
- Value
Custom labels
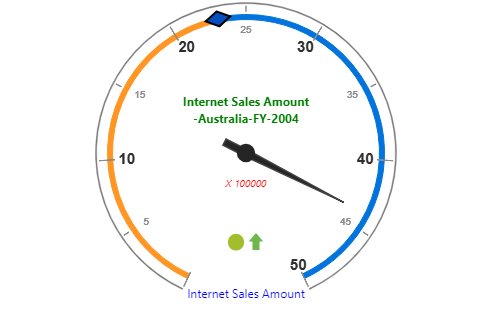
Labels can be customized with any text, location, background color, and size.
Label format
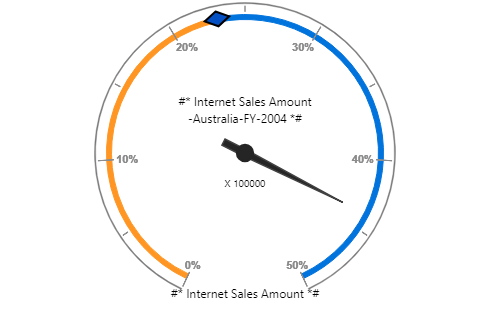
Labels support various formatting options so that they can be displayed in any necessary format. For instance, the percent sign can be specified after the label value.
Frame types
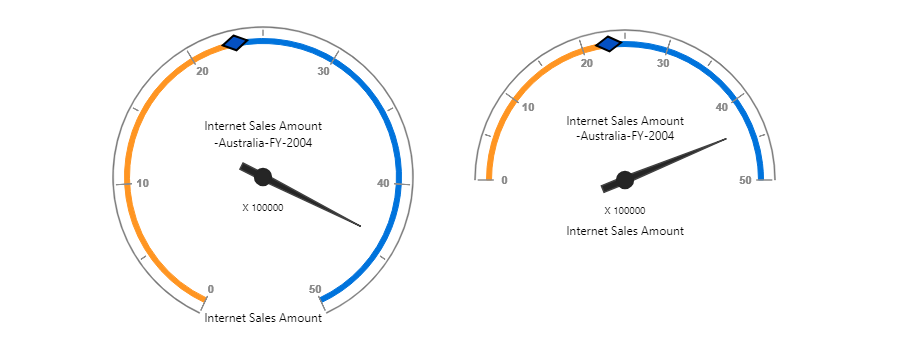
The JavaScript Pivot Gauge supports full-circle and half-circle gauges for visualizing data in compact areas by modifying the start and end angles.
Key elements

Scale
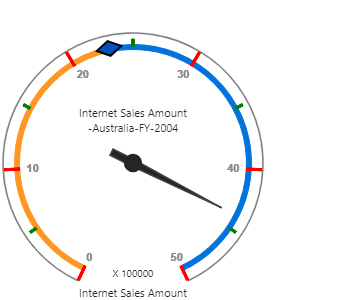
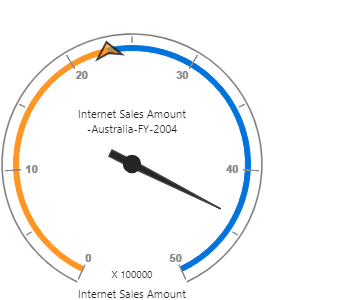
The scale of the gauge is a circular arc that supports a range of numbers bound by minimum and maximum values.
Pointer
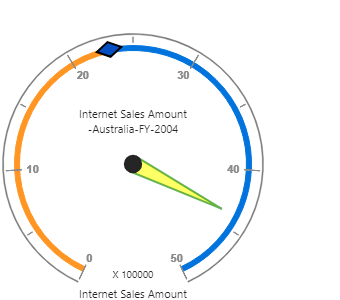
The pointer is a needle-type element that indicates the current value on the scale.
Ranges
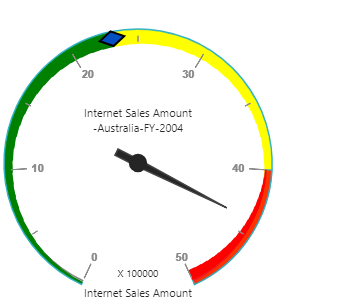
Highlight a range of values. Ranges can show different colors to help you quickly visualize where a value falls on a scale.

Indicators
Indicators let users view status and trends, showing progress toward a goal.
Flexible layout
Easily arrange multiple gauges in a structured layout by specifying row and column count. Based on the specified values, gauges will be arranged in the available space.

Tooltip
Display basic information in tooltips while hovering individual gauges.

Custom Style and Themes

Built-in Themes
The JavaScript Pivot Gauge ships with a set of 13 stunning, built-in themes, including Azure, lime, and saffron themes in light, dark, and gradient patterns.

Custom Style
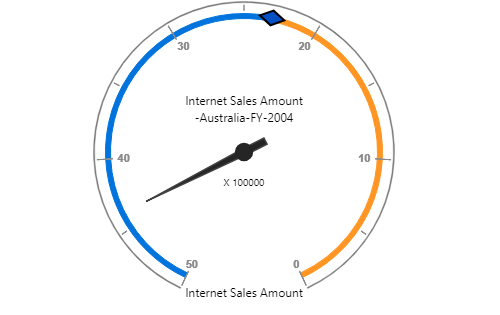
Customize the appearance of the control by changing the styles of the pointer, pointer cap, scales, ticks, labels, and state indicators.
Globalization and Localization

Globalization
Users from different locales can use the control by applying specific date formats, currency formats, and number formats to suit their locale preferences.
Developer-friendly API
Users can completely define the JavaScript Pivot Gauge control through built-in API settings based on their application needs.
Cross-browser and cross-platform
The JavaScript Pivot Gauge control works on all major browsers across Windows and macOS. It is written in jQuery to provide the same working experience on popular browsers like Chrome 17+, Firefox 22+ and Internet Explorer 8+. It also works with various platforms like ASP.NET Web Forms, ASP.NET MVC, ASP.NET Core,TypeScript, PHP and JSP.

Third-party framework support
The JavaScript Pivot Gauge control has built-in integration with popular third-party frameworks like Angular, React, Ember, and Aurelia. Check out the following examples to see the control’s unique features for each platform:
75+ jQuery UI WIDGETS
Our Customers Love Us


 Documentation
Awards
Greatness—it’s one thing to say you have it, but it means more when others recognize it. Syncfusion® is proud to hold the following industry awards.
