Trusted by the world’s leading companies

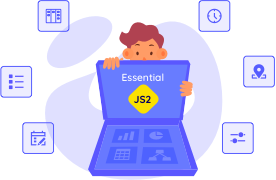
Overview
HeatMap chart control is used for representing tabular data values as gradient colors instead of numbers. Low and high values are different colors with different gradients.

Two Types of Data Source Mapping (Table Mapping, Cell Mapping)
HeatMap chart provides support to configure a data source in two ways and map rows and columns to visualize.
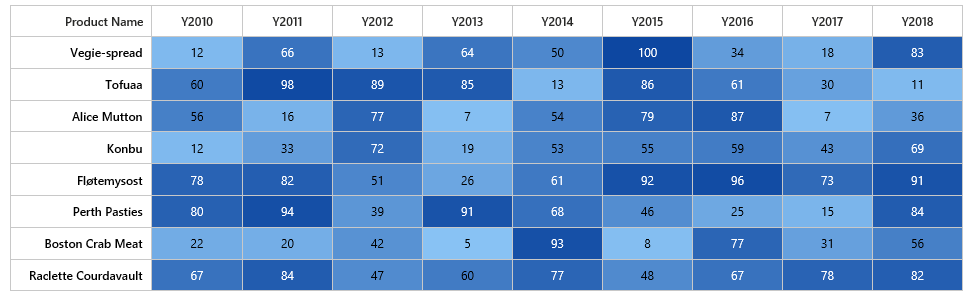
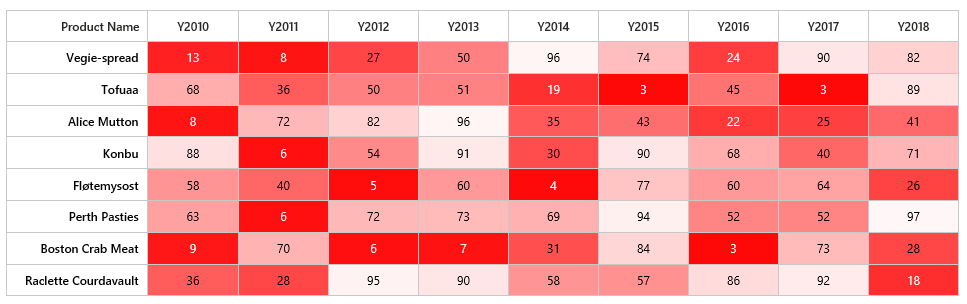
Color Mapping
Color mapping is used to configure values as colors instead of numerical values. For example, if a heat map represents data from 0 to 100, ColorMapping is used to specify a color for the lowest value and highest value. For any value between those, a medium color will be automatically chosen.
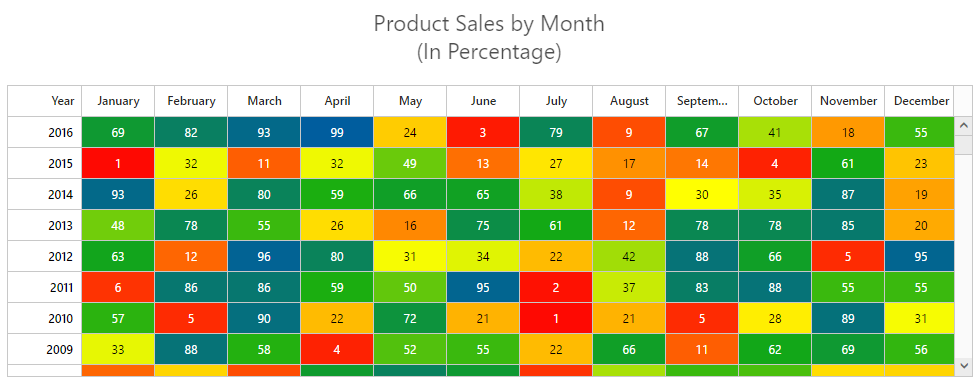
Legend
Legend is a control used to summarize the range of colors in heat map. This gives a visual guideline for mapping between value and color.

Virtualization
The virtual scrolling support allows you to load data that you require (load data based on page size) without buffering the entire, huge database.
75+ jQuery UI WIDGETS
ALL WIDGETS
GRIDS
DATA VISUALIZATION
EDITORS
NAVIGATION
NOTIFICATION
FRAMEWORK
MISCELLANEOUS
BUSINESS INTELLIGENCE
REPORTING
FILE FORMAT LIBRARY
Media
Our Customers Love Us
Having an excellent set of tools and a great support team, Syncfusion® reduces customers’ development time.Here are some of their experiences.

We're using the file formats and Windows/JavaScript list controls a lot. They're fast, easy to use, and the documentation is good and contains examples. Tickets with questions or suggestions were answered within a day, so we're happy to use the Syncfusion libraries.
Using Syncfusion Angular and JavaScript controls makes front-end web development a piece of cake. Each component has many properties that can be configured as per your desire, methods that can be used to interact with the element, and a lot of events that trigger at different stages, which makes modifying your components according to the state of the application an easy task. Also, their support is amazing! They always offer a sample working project, which makes it very simple to solve your question about your code.
Rated by users across the globe
Syncfusion jQuery Resources
Learning
 Documentation
 Documentation


Awards
Greatness—it’s one thing to say you have it, but it means more when others recognize it. Syncfusion® is proud to hold the following industry awards.

