
In this tech-driven world, physical instruments are not used anymore to visualize units of temperature, speed, and other data. Every bit of detail is shown accurately using mobile phones and other electronic devices.
Designing a temperature-monitoring application has become an effortless task with our Syncfusion Flutter Radial Gauge widget.
In this blog, you are going to learn how to create a temperature monitor application using various features of the Flutter Radial Gauge widget.

We’ll use the following features of the Radial Gauge widget:
Axes: To display the temperature range from its minimum to maximum values with specific intervals in the radial scale along with the labels and ticks
Range: To indicate the temperature range. Multiple ranges can be added to explain the level of severity of the temperature level. The range appearance is highly customizable with gradient colors.
Pointer: To point to the current value in the temperature scale.
Annotation: To represent the unit of temperature provided in the corresponding radial scale.
Configuring Radial Gauge widget
Follow the instructions provided in the Getting Started documentation to create a basic project in Flutter.
Add Radial Gauge dependency
Include the Syncfusion Flutter Radial Gauge package dependency in the pubspec.yaml file in your project.
syncfusion_flutter_gauges: ^18.1.45
Get package
To get the referenced package, run the following command in the terminal window of your project.
$ flutter pub get
Import package
Import the Radial Gauge package into your main.dart file as shown in the following code example.
import 'package:syncfusion_flutter_gauges/gauges.dart';
Add Radial Gauge widget
Once the Radial Gauge package is imported in the sample, initialize the Radial Gauge widget and add it to the widget tree.
@override
  Widget build(BuildContext context) {
    return Scaffold(
      body: Center(
        child: SfRadialGauge(),
      ),
    );
  }
Design temperature scale
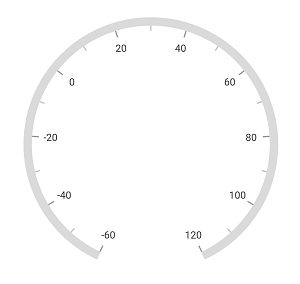
In the process of designing the temperature monitor, the very first step is to design a temperature scale to display the temperature range.
To achieve this, you need to initialize a radial axis and add it to the axes collection of the widget.
The radial axis allows you to display scale values that represent temperature in the axis labels of the circular scale from desired minimum to maximum values with the predefined interval.
You can use the minimum and the maximum properties of the radial axis to define the minimum and maximum temperature values of the temperature scale. The interval property of radial axis is used to control the scale interval.
To customize the temperature scale start and end positions, use the startAngle and endAngle properties of the radial axis.
axes: <RadialAxis>[
        RadialAxis(
          minimum: -60,
          maximum: 120,
          interval: 20,
          startAngle: 115,
          endAngle: 65,
        ),
      ]
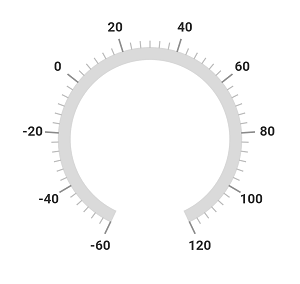
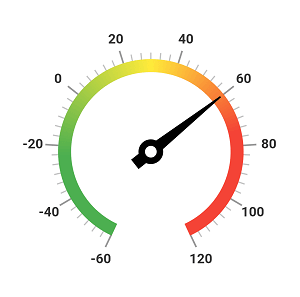
The major elements present in the temperature scale are labels, an axis line, and major and minor ticks.
In this demo, the following properties of a radial axis are used to design this highly customizable temperature scale:
axisLineStyle: To customize the appearance of temperature scale line.
axisLabelStyle: To customize the appearance of temperature labels.
minorTicksPerInterval: To increase the number of minor tick counts per interval.
majorTickStyle: To customize the appearance of ticks corresponding to the temperature scale labels.
minorTickStyle: To customize the appearance of minor ticks that occur between the axis labels.
ticksPosition: To place the major and minor ticks either inside or outside the axis line.
labelsPosition: To place the axis labels either inside or outside the axis line.
radiusFactor: To customize the size of the radial axis.
axes: <RadialAxis>[
        RadialAxis(
          ticksPosition: ElementsPosition.outside,
          labelsPosition: ElementsPosition.outside,
          minorTicksPerInterval: 5,
          axisLineStyle: AxisLineStyle(
            thicknessUnit: GaugeSizeUnit.factor,
            thickness: 0.1,
          ),
          axisLabelStyle:
              GaugeTextStyle(fontWeight: FontWeight.bold, fontSize: 16),
          radiusFactor: 0.97,
          majorTickStyle: MajorTickStyle(
              length: 0.1, thickness: 2, lengthUnit: GaugeSizeUnit.factor),
          minorTickStyle: MinorTickStyle(
              length: 0.05, thickness: 1.5, lengthUnit: GaugeSizeUnit.factor),
          minimum: -60,
          maximum: 120,
          interval: 20,
          startAngle: 115,
          endAngle: 65,
        ),
      ]
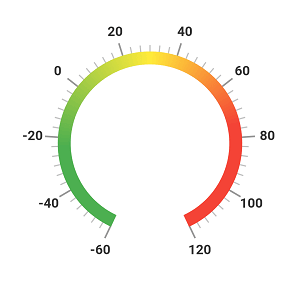
Add temperature range indicator
Once the temperature scale design is completed, add the temperature range indicator to indicate the level of severity of the temperature.
To achieve this, add a single range with gradient colors or multiple ranges using the ranges collection property of the radial axis.
In this demo, we have added a single range with gradient colors to indicate the severity of the temperature:
- The green color indicates the low-temperature range.
- The yellow color indicates the moderate temperature range.
- The red color indicates the high-temperature range.
The start and the end values of the range can be controlled with the startValue and endValue properties. To customize the range width and color, use width and gradient properties, respectively.
ranges: <GaugeRange>[
              GaugeRange(
                  startValue: -60,
                  endValue: 120,
                  startWidth: 0.1,
                  sizeUnit: GaugeSizeUnit.factor,
                  endWidth: 0.1,
                  gradient: SweepGradient(
                      stops: <double>[0.2, 0.5, 0.75],
                      colors: <Color>[Colors.green, Colors.yellow, Colors.red]))
            ]
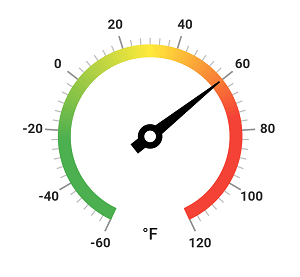
Design needle pointer to indicate current temperature value
Add a needle pointer to the pointers collection of the radial axis to indicate the current temperature value in the axis.
Customize the appearance of the needle pointer with its various properties:
needleColor: To customize the needle color.
tailStyle: To customize the tail appearance of the needle.
knobStyle: To customize the knob appearance.
needleLength: To alter the needle length.
needleStartWidth: To customize the start width of the needle.
needleEndWidth: To customize the end width of the needle.
pointers: <GaugePointer>[
              NeedlePointer(
                  value: 60,
                  needleColor: Colors.black,
                  tailStyle: TailStyle(
                      length: 0.18,
                      width: 8,
                      color: Colors.black,
                      lengthUnit: GaugeSizeUnit.factor),
                  needleLength: 0.68,
                  needleStartWidth: 1,
                  needleEndWidth: 8,
                  knobStyle: KnobStyle(
                      knobRadius: 0.07,
                      color: Colors.white,
                      borderWidth: 0.05,
                      borderColor: Colors.black),
                  lengthUnit: GaugeSizeUnit.factor)
            ],
Annotate temperature unit
In this example, we have used gauge annotation to indicate whether the temperature unit type is °F or °C.
The text widget displays the current unit. This text is set to the widget property and placed in the desired location with the positionFactor and angle properties of gauge annotation.
annotations: <GaugeAnnotation>[
                GaugeAnnotation(
                    widget: Text(
                      '°F',
                      style:
                          TextStyle(fontSize: 20, fontWeight: FontWeight.w600),
                    ),
                    positionFactor: 0.8,
                    angle: 90)
              ],
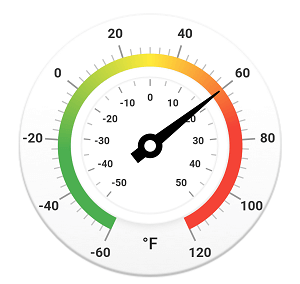
Add a Celsius scale
In the above section, we designed the scale to display the temperature value in Fahrenheit. Now you are going to add a temperature scale in Celsius (°C).
To create a scale in °C, initialize a radial axis and insert it at the zeroth index of the axes collection so that the needle pointer of the previous axis is rendered on the top of this axis
For Celsius scale, we are going to use the backgroundImage property of the radial axis.
In this demo, AssetImage is provided as the background image of the radial axis. Refer to this KB to learn how to set the AssetImage as a background image for a radial axis
axes: <RadialAxis>[
          RadialAxis(
              backgroundImage: const AssetImage('images/light_frame.png')),
        ]
Customize the appearance of the temperature scale (°C) by using the various properties of the radial axis.
RadialAxis(
            backgroundImage: const AssetImage('images/light_frame.png'),
            minimum: -50,
            maximum: 50,
            interval: 10,
            radiusFactor: 0.5,
            showAxisLine: false,
            labelOffset: 5,
            useRangeColorForAxis: true,
            axisLabelStyle: GaugeTextStyle(fontWeight: FontWeight.bold),
          ),
As in the temperature scale in °F, the ranges are added in this axis, too, to indicate the level of severity of the temperature range.
ranges: <GaugeRange>[
            GaugeRange(
                startValue: -50,
                endValue: -20,
                sizeUnit: GaugeSizeUnit.factor,
                color: Colors.green,
                endWidth: 0.03,
                startWidth: 0.03),
            GaugeRange(
                startValue: -20,
                endValue: 20,
                sizeUnit: GaugeSizeUnit.factor,
                color: Colors.yellow,
                endWidth: 0.03,
                startWidth: 0.03),
            GaugeRange(
                startValue: 20,
                endValue: 50,
                sizeUnit: GaugeSizeUnit.factor,
                color: Colors.red,
                endWidth: 0.03,
                startWidth: 0.03),
          ],
In this axis, set the individual range color to the corresponding ticks and axis labels using the useRangeColorForAxis property of the radial axis.
annotations: <GaugeAnnotation>[
                GaugeAnnotation(
                    widget: Text(
                      '°C',
                      style:
                          TextStyle(fontSize: 20, fontWeight: FontWeight.w600),
                    ),
                    positionFactor: 0.8,
                    angle: 90)
              ],
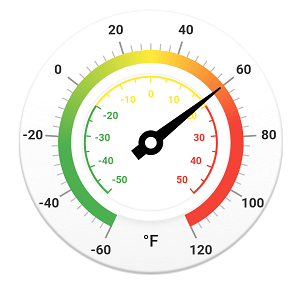
As with the previous axis, annotation is added for displaying the temperature units of the axis.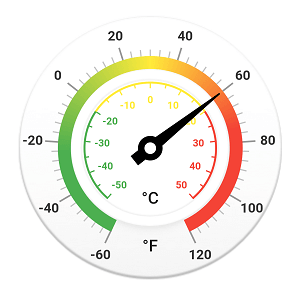
You can download the entire sample code of this demo from this GitHub location

Conclusion
I hope you now have a clear idea about the various features available for the Syncfusion Flutter Radial Gauge widget and how to create a highly customizable application with them.
Browse our documentation to learn more about our Flutter widgets. You can find all our new features and controls in our release notes and What’s New page.
You can also see Syncfusion’s Flutter app with many examples in this GitHub repo. Don’t miss our demo app in Google Play and the App Store.
If you have any questions about this control, please let us know in the comments section. You can also contact us through our support forum, support portal, or feedback portal. We are happy to assist you!


 No spam, just valuable updates.