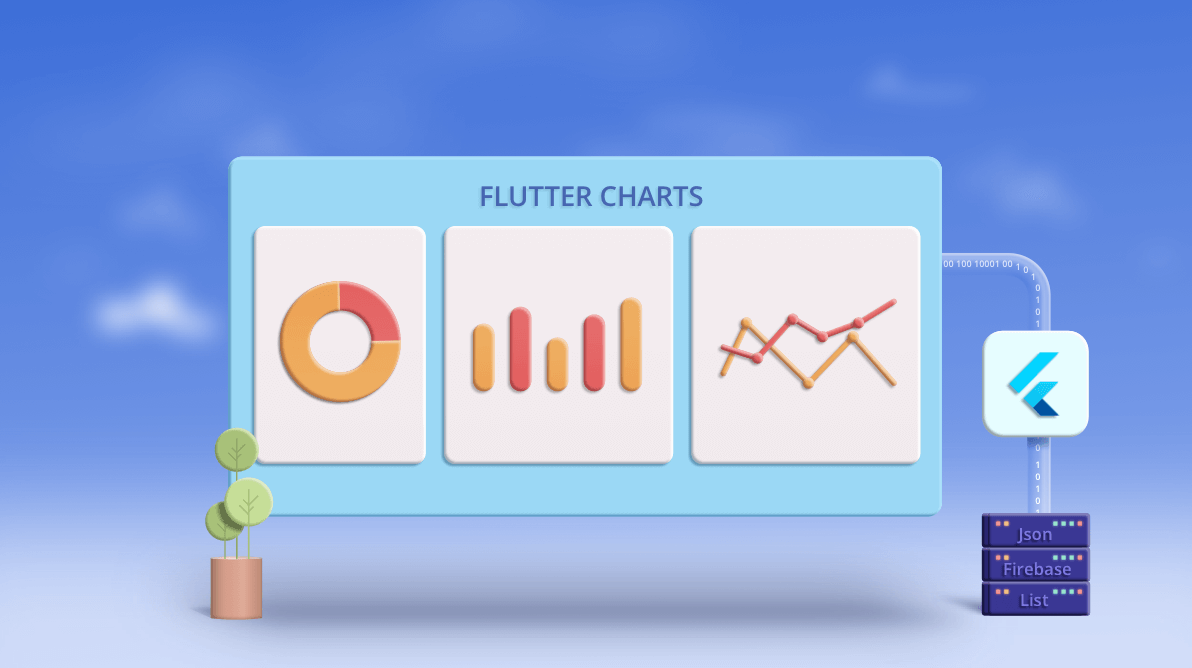
This blog provides show notes for our May 20 webinar, “Load Data from Multiple Sources into a Flutter Chart.” The webinar was presented by Syncfusion Product Manager Jayavigneshwaran G. If you missed it, or would like to watch it again, please see our YouTube page or watch it here:
Overview
During this webinar, we walked through the step-by-step process for binding data to the Flutter Charts widget from various data sources (JSON, lists, and Firebase).
Agenda
- Exploring Syncfusion Flutter Charts’s key features.
- How to build an app from scratch with the Charts widget.
- What are the different sources for loading data to a chart?
- Step-by-step procedure to bind data from multiple sources to a chart.
Syncfusion Flutter Charts
Syncfusion Flutter Charts is a data visualization library written natively in Dart for creating beautiful, animated, and high-performance charts, which are used to craft high-quality Flutter app user interfaces.
Key features
- 30+ chart types, ranging from the popular line, bar, area, and pie charts to financial charts like candle and OHLC.
- Support for 5 axis types: numeric, category, date-time, date-time category, and logarithmic.
- Various user interactive features like zooming and panning, tooltip, trackball, and selection.
- Rich feature set.
- Fluid animation.
- Complete customizability.
- Real-time updates to create real-time charts.
- High performance: able to render a huge amount of data in a few seconds.
How to build an app from scratch with the chart
- Create a new Flutter project.
- Add syncfusion_flutter_charts as a dependency in the pubspec.yaml file.
- Import the Charts library in the main.dart file.
- Remove the code of the default project and add the SfCartesianChart widget in the widget tree.
- Run the application.
What are the different source types for loading data to a Flutter chart?
- List (user-defined class type)
- This is the most common and simple data-binding method.
- List (predefined types)
- The list type can be int, double, string, date-time, etc.
- JSON
- JSON is a commonly used data format. Most large data sets, like historical data, financial data, and day-to-day stock price details, will be maintained as JSON data.
- Firebase database
- Google’s Firebase database is a cloud-hosted database in which the data is stored in JSON format.
Binding a user-defined list to a chart
- Create a class and add required fields.
- Create a list of that class type and add data to it.
- Assign it to the dataSource property in the chart.
Binding a predefined list to a chart
- Create a class and add required fields.
- Create a list of that class type and add data to it by iterating the arrays.
- Assign it to the dataSource property in the chart.
Binding JSON data to a chart
- Place the JSON file in the assets folder and reference it in the pubspec.yaml file.
- Create a class and add required fields. Define a factory ctor for parsing JSON.
- Load the raw JSON string and convert it to a list by decoding it.
- Create a list and add data to it by iterating it. Assign it to the dataSource property in the chart.
Binding data from Firebase to a chart
- Get and parse the JSON data from the Firebase URL.
- Create a class and add required fields. Define a factory ctor for parsing JSON.
- Load the fetched raw JSON string and convert it to a list by decoding it.
- Create a list and add data to it by iterating it. Assign it to the dataSource property in the chart.
Knowledge-base articles
Conclusion
During this webinar, we looked at binding data to the Flutter Charts widget from various data sources.
We hope you enjoyed this webinar and please keep an eye out for our future Flutter webinars. If you have a topic you’d like to see covered in a webinar, please let us know in the comment section below.
Recommended resources (related links)
- Getting started with Flutter documentation.
- Packages available in dev.
- Search “Syncfusion” and you will see all the packages.
- Syncfusion Flutter webpage.
- Flutter Succinctly e-book by Ed Freitas.


