
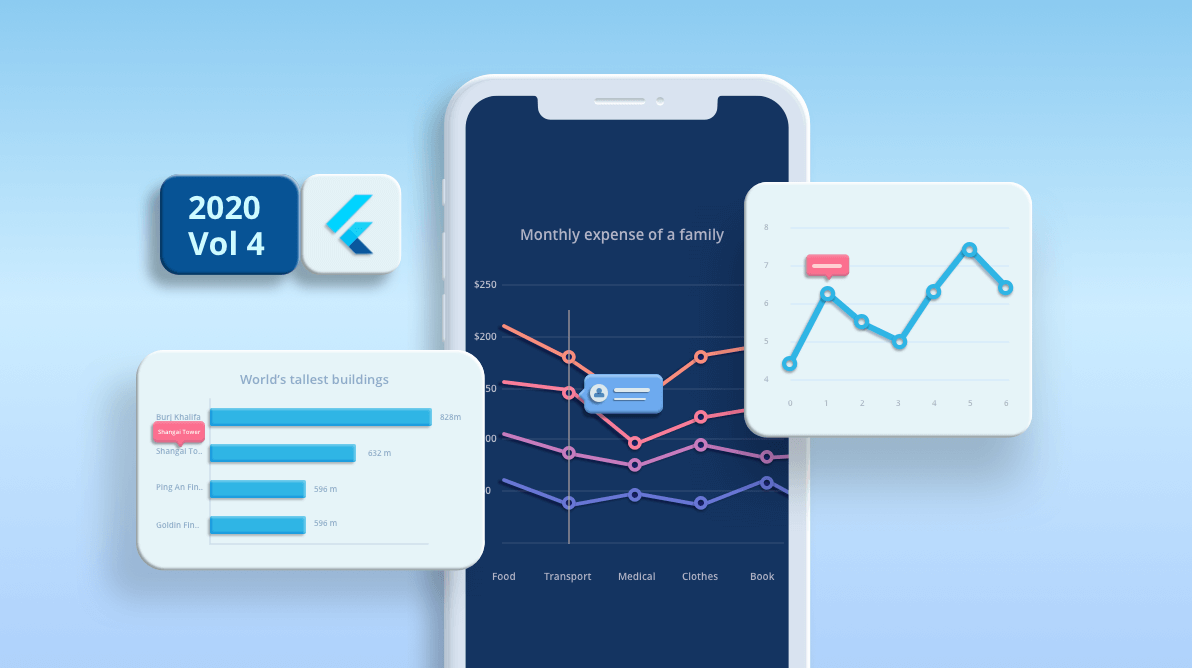
The team at Syncfusion has been hard at work on the Flutter Charts widget, which can be used to create stunning charts and graphs. The new version available in the 2020 Volume 4 release has some great new features and enhancements.
This blog will give you information about the new features of the Charts widget and how they work.
Let’s see them!
Maximum width for axis labels
You can restrict the size of the axis labels by specifying a maximum text width. There are two scenarios in which this is applicable:
Maximum label width
If an axis label exceeds the specified width, it will get trimmed and an ellipsis (…) will be added at the end of the trimmed text. This can be achieved by using the maximumLabelWidth property in the axis. As the default value is null, labels will not be trimmed by default.
Labels extent
If an axis label exceeds the specified value, like the maximumLabelWidth feature, the axis label will be trimmed and an ellipsis (…) will be added at the end of the trimmed text. If an axis label width is within the specified value, white space will be added at the beginning to make up the remaining width. This is done to maintain uniform bounds and to eliminate axis label flickering on zooming and panning. This can be achieved by using the labelsExtent property in the axis.
Complete label text will be shown in a tooltip when tapping or clicking over the trimmed axis labels in both scenarios.
[Dart]
@override
Widget build(BuildContext context) {
  return Container(
    child: SfCartesianChart(
      primaryXAxis: CategoryAxis(
        maximumLabelWidth: 80
      ),
      series: <ChartSeries<SalesData, String>>[
        BarSeries<SalesData, String>(
          dataSource: <SalesData>[
            SalesData('Goldin Finance 117', 597),
            SalesData('Ping An Finance Center', 599),
            SalesData('Makkah Clock Royal Tower', 601),
            SalesData('Shanghai Tower', 632),
            SalesData('Burj Khalifa', 828)
          ],
          xValueMapper: (SalesData sales, _) => sales.year,
          yValueMapper: (SalesData sales, _) => sales.sales
        ),
      ]
    )
  );
}
SB sample: https://flutter.syncfusion.com/#/cartesian-charts/axis-features/maximum-width-for-labels
Template support for trackball
You can add any custom widget as a trackball tooltip using the builder property in the TrackballBehavior class. If the trackball display mode is groupAllPoints or nearestPoint, it will be called once, and if it is floatAllPoints, it will be called for each point.
[Dart]
@override
  Widget build(BuildContext context) {
    return Scaffold(
      child: Center(
        child: Container(
          child: SfCartesianChart(
            trackballBehavior: TrackballBehavior(
              enable: true,
              builder: (BuildContext context, TrackballDetails trackballDetails) {
                return Container(
                  height: 50,
                  width: 150,
                  decoration: BoxDecoration(
                    color: Color.fromRGBO(0, 8, 22, 0.75),
                    borderRadius: BorderRadius.all(Radius.circular(6.0)),
                  ),
                  child: Row(
                    children: [
                      Padding(
                        padding: EdgeInsets.only(left: 5),
                        child: SizedBox(
                          child: Image.asset('images/People_Circle16.png'),
                          height: 30,
                          width: 30
                        )
                      ),
                      Center(
                        child: Container(
                          padding: EdgeInsets.only(top: 11, left: 7),
                          height: 40,
                          width: 100,
                          child: Text('${trackballDetails.point.x.toString()} : \${trackballDetails.point.y.toString()}',
                            style: TextStyle(
                              fontSize: 13,
                              color: Color.fromRGBO(255, 255, 255, 1)
                            )
                          )
                        )
                      )
                    ]
                  )
                );
              },
            ),
            series: <CartesianChart<SalesData, String>>
              [
                SplineSeries<SalesData, double>(
                  dataSource: data,
                  xValueMapper: (SalesData sales, _) => sales.year,
                  yValueMapper: (SalesData sales, _) => sales.sales
                )
              ]
            )
          )
        )
      );
    }
SB sample: https://flutter.syncfusion.com/#/cartesian-charts/user-interactions/trackball/chart-with-trackball
UG link: https://help.syncfusion.com/flutter/cartesian-charts/trackball-crosshair#trackball-tooltip-template
Pixel and point value conversions
Pixel to point
Convert a logical pixel value to a chart data point. This feature helps add the data points dynamically on interaction. This can be done by passing a logical pixel value as input to the pixelToPoint method, which then returns the chart data point. Since this method is in the series controller, x-axis and y-axis coordinates associated with this particular series will be considered for the conversion.
Point to pixel
Convert a chart data point value to a logical pixel value. This can be done by passing chart data point value as input to the pointToPixel method, which returns the logical pixel value. Since this method is in the series controller, x-axis and y-axis coordinates associated with this particular series will be considered for conversion.
[Dart]
@override
Widget build(BuildContext context) {
  ChartSeriesController seriesController;
  return Container(
    child: SfCartesianChart(
      series: <CartesianSeries<ChartSampleData, num>>[
        LineSeries<ChartSampleData, num>(
          onRendererCreated: (ChartSeriesController controller) {
            seriesController = controller;
          },
        )
      ],
      onChartTouchInteractionUp: (ChartTouchInteractionArgs args) {
        final Offset value = Offset(args.position.dx, args.position.dy);
        CartesianChartPoint<dynamic> chartpoint = seriesController.pixelToPoint(value);
          print('X point: ${chartpoint.x}');
          print('Y point: ${chartpoint.y}');
      }
    )
  );
}UG link: https://help.syncfusion.com/flutter/cartesian-charts/methods#pixeltopoint
Callback improvements
Along with the point index, you can now get the viewport point index from onDataLabelRender, onDataLabelTapped, onMarkerRender, onPointTapped, onSelectionChanged, and onTooltipRender callbacks. Point index is the index of the data point formed based on the overall data points in the series. The viewport point index value is based on the visible data points available on the view port.
[Dart]
SfCartesianChart(
  onDataLabelTapped: (DataLabelTapDetails args) {
    print(args.viewportPointIndex);
  },
  series: <ChartSeries<SalesData, num>>[
    ColumnSeries<SalesData, num>(
      dataSource: chartData,
      xValueMapper: (SalesData sales, _) => sales.year,
      yValueMapper: (SalesData sales, _) => sales.sales,
      dataLabelSettings: DataLabelSettings(
        isVisible: true
      )
    )
  ]
)
Conclusion
I hope you now have a clear idea of the new features available in the Syncfusion Flutter Charts widget for the 2020 Volume 4 release. For more details about the bug fixes and other enhancements, check out our release notes.
Browse our documentation to learn more about our Flutter widgets. You can also see Syncfusion’s Flutter app with many examples in this GitHub repo. Don’t miss our demo app in Google Play and the App Store.
If you aren’t a customer yet, you can try our 30-day free trial to check out these features.
Also, if you wish to send us feedback or would like to submit any questions, please feel free to post them in the comments section of this blog post. You can also contact us through our support forum, feedback portal, or Direct-Trac support system. We are always happy to assist you!


 No spam, just valuable updates.