
TL;DR: Confused between Bar Graphs and Histograms? Learn the 8 Key Differences That Help You Pick the Right Chart Every Time.
Choosing between a bar graph vs histogram can significantly impact your data visualization success. Though both use bars to represent data, their purposes differ markedly. A bar graph/bar chart showcases categorical data with distinct gaps, while a histogram illustrates continuous data distributions without gaps.
In this guide, we explore 8 key differences in the bar graph vs histogram comparison, offering examples and practical tips. Whether you’re a data analyst, developer, or student, mastering these distinctions will empower you to select the ideal chart for your analysis.
Bar chart
A bar chart, which is also widely known as a column chart, is used to compare the frequency, count, total, or average of data in different categories by using vertical or horizontal bars. Discrete categories comparison is graphically visualized using a bar chart.
Bars require two values, x and y, to render. The x value might be string, numeric, date-time, log, etc. The y value should always be numeric. The x-axis shows the categories being compared, whereas the y-axis shows the measured value. Each bar represents a category and is rendered with equal width but with varying length. The length of the bar is based on its y value.
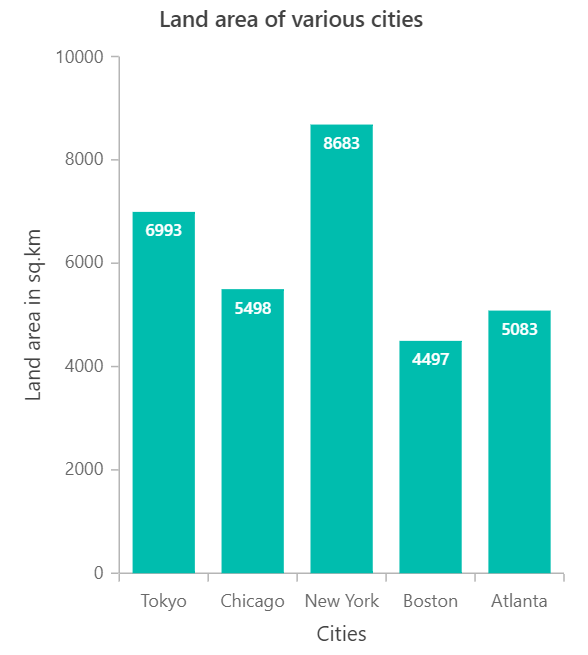
In the above screenshot, the first bar represents that Tokyo’s land area is 6,993 sq. km.
Histogram chart
A histogram chart looks like bar chart. It is used to represent the distribution of numerical data by rendering vertical bars. Non-discrete values comparison is graphically visualized using a histogram chart. For example, the count of students who earned marks on an exam in various ranges can be visualized easily with a histogram chart.
Only one set of numeric values is required to render the histogram chart. The x-axis shows the ranges of value, whereas the y-axis shows the count of the occurrences. Each block represents the number of occurrences within a specific range. The ranges are split based on the specified bin value.
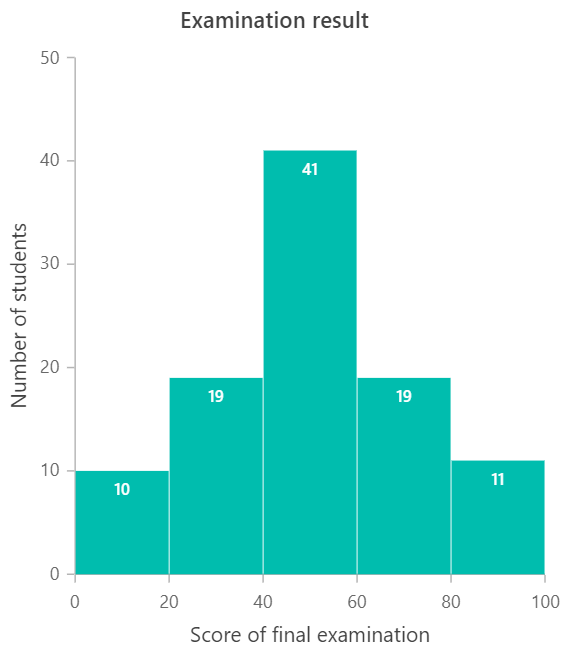
In the previous screenshot, bin value is set to 20, so the x-axis is split with 20 as the interval. The first bar represents that there are 10 values lying between 0 and 20 in the provided data.
Comparison table (Bar chart vs Histogram)
| Comparison terms | Bar chart | Histogram chart |
| Usage | To compare different categories of data. | To display the frequency of occurrences. |
| Indicates | Discrete values. | Non-discrete values. |
| Data | Categorical data. | Quantitative data. |
| Rendering | Each data point is rendered as a separate bar. | The data points are grouped and rendered based on the bin value. |
| Space between bars | Can have space. | No space. |
| Reordering bars | Can be reordered. | Cannot reordered. |
| Axis label placement | Axis labels can be placed on or between the ticks. | Axis labels are placed on the ticks. |
| Required values | x and y. | Only y. |

Comparison example
Here, you can see the output in a bar chart and a histogram chart for the same data set [0, 7, 9, 15, 19, 13, 8, 4, 24, 8].

From the previous screenshot, we can understand that the bar chart renders bars for all the data points. The length of the bars is based on the y value. The width and spacing between the bars are maintained equally. But, in the histogram chart, the bars are rendered for grouped values. Here, the bin value is specified as 10 and six values lie between 0 and 10, three values lie between 10 and 20, and one value lies between 20 and 30.
Conclusion
We hope that now you understand the differences between Bar graph and Histogram, where and how to use the bar chart and histogram chart types. Are you interested in integrating and using them in your application? Syncfusion offers charting components for various platforms to visualize data graphically. Check out our Charts component for different platforms from the following list:
- ASP.NET Core
- ASP.NET MVC
- JavaScript
- React
- Vue
- .NET MAUI
- Flutter
- Angular
- Blazor
- WinForms
- WinUI
- WPF
- UWP
Also, if you wish to send us feedback or would like to submit any questions, please feel free to post them in the comments section of this blog post. You can also contact us through our support forum, feedback portal, or support portal.
Happy charting!
 No spam, just valuable updates.
Comments (1)
Good one ☝️