

Syncfusion Blazor Charts is a well-crafted charting component for visualizing data. It contains a rich gallery of 30+ charts and graphs, ranging from line to financial charts, that cater to all charting scenarios.
In this blog, we will go through the new features and improvements included in the Blazor Charts component for the 2022 Volume 1 release.
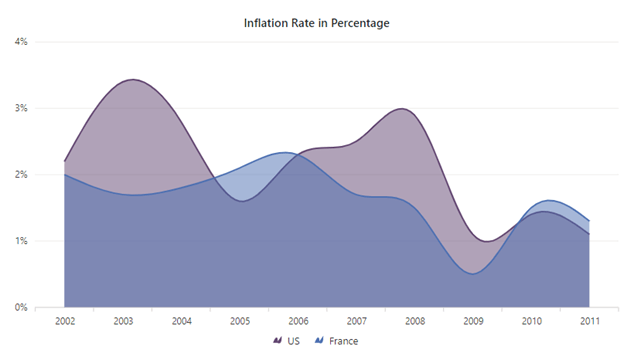
Border support for area charts
Area charts are mostly used to represent time-dependent data at equal intervals, showing the trends in the data. Now, you can add borders for these charts: area, spline area, step area, and stacking area.
Refer to the following code example.
<ChartSeriesCollection>
 <ChartSeries Type="ChartSeriesType.SplineArea">
  <ChartSeriesBorder Width="2"></ChartSeriesBorder>
 </ChartSeries>
 <ChartSeries Type="ChartSeriesType.SplineArea">
  <ChartSeriesBorder Width="2"></ChartSeriesBorder>
 </ChartSeries>
</ChartSeriesCollection>
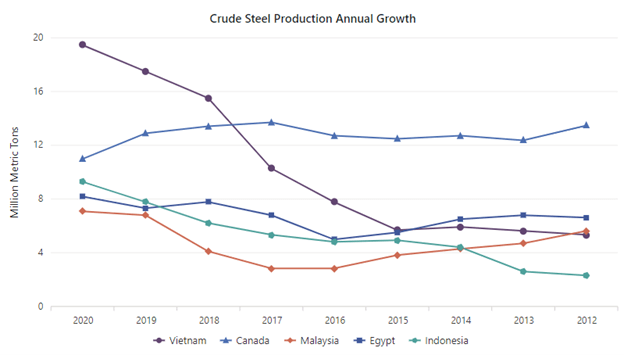
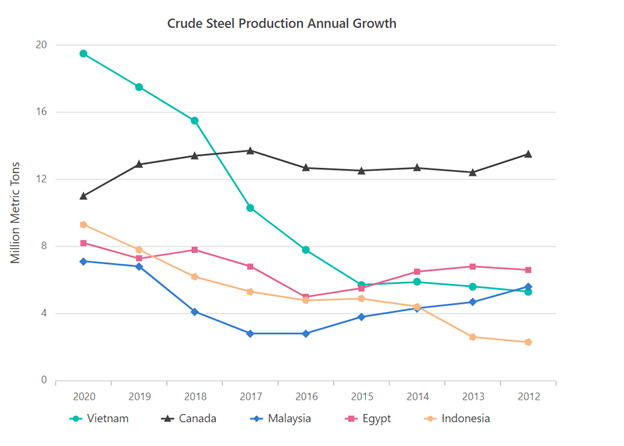
Filled marker
Markers are mainly used to represent data points with different shapes like circles, rectangles, triangles, or diamonds. Now, you can fill the marker for the data points with the series or data point’s color using the IsFilled property of the marker for the series.
Refer to the following code example.
<ChartSeries Type="ChartSeriesType.Line">
 <ChartMarker Visible="true" IsFilled="true" Shape="ChartShape.Triangle">
 </ChartMarker>
</ChartSeries>
Legend item spacing
With 2022 Volume 1, you can easily customize the space between legend items in charts using the ItemPadding property.
The following code example shows how to do this.
<ChartLegendSettings ItemPadding="30"></ChartLegendSettings>
Highlight on legend hovering
Instead of highlighting the series when hovering the cursor over both the legend and series, you can now set the chart to highlight the series only when hovering over the legend. This will be useful when you want to figure out the series corresponding to the legend item.
Refer to the following code example.
<ChartLegendSettings Enablehighlight="true"></ChartLegendSettings>
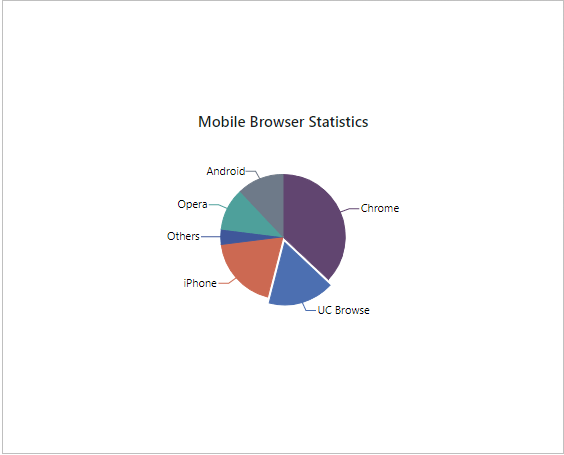
Pie title placement
Now, the chart title will be placed near the pie and doughnut charts based on their radius. This will enhance the appearance of the charts.
 Tooltip improvements
In this 2022 Volume 1 release, we have improved the appearance of the tooltip and added an animation effect for a smooth transition while moving from one point to another in charts.
Refer to the following GIF image.
Keyboard navigation
Keyboard accessibility is one of the most important aspects of web accessibility. Users with motor disabilities rely on the keyboard and many users prefer to use the keyboard for navigation to achieve better efficiency.
The Blazor Charts component now supports keyboard navigation, which allows you to interact with the chart elements easily using keys.
The Blazor Charts component supports the following keyboard shortcuts.
| Interaction Keys | Description |
| Tab | Moves the focus to the next element in the chart. |
| Shift + Tab | Moves the focus to the previous element in the chart. |
| Down Arrow | Moves the focus to the data point to the left of the selected point. |
| Up Arrow | Moves the focus to the data point to the right of the selected point. |
| Left Arrow | Moves the focus to the next series in the chart. |
| Right Arrow | Moves the focus to the previous series in the chart. |
| ESC | Cancels the tooltip for the data point. |
| Enter/Space | Selects the data point in the series. |
| Down/Left Arrow | Moves the focus to the legend item to the left of the selected legend. |
| Up/Right Arrow | Moves the focus to the legend item to the right of the selected legend item. |
| Enter/Space | Toggles the visibility of the corresponding series. |
| Ctrl + + | Zooms in the chart. |
| Ctrl + – | Zooms out the chart. |
| Down/Up Arrow | Pans the chart vertically after zooming. |
| Right/Left Arrow | Pans the chart horizontally after zooming. |
| R | Resets the zoomed chart. |
| Ctrl + P | Prints the chart. |
Conclusion
Thanks for reading! In this blog post, we walked through the new features and enhancements in the Blazor Charts component available in our 2022 Volume 1 release. Explore the Blazor Charts user guide to see all the available features. You can check out the list of new features in our release notes and What’s New pages. Try out these stunning new features and leave your feedback in the comments section below!
If you are an existing Syncfusion user, please download the latest version of Essential Studio® from the License & Downloads page and try the new features for yourself. If you aren’t a customer yet, you can try our 30-day free trial to check out these features.
If you have questions, you can contact us through our support forum, support portal, or feedback portal. We are always happy to assist you!
[


 No spam, just valuable updates.