

At Syncfusion, we are continuously reviewing the constructive questions and comments we receive from our customers, which include various feature requests. From these, we handpicked the most widely requested features and made them available in the Essential Studio® 2020 Volume 3 release.
In this blog post, I’ll quickly review the new chart types and features included in the Flutter Charts widget for the 2020 Volume 3 release.
Let’s see them!
New chart types
We extended the Syncfusion Flutter Charts widget to support two more chart types:
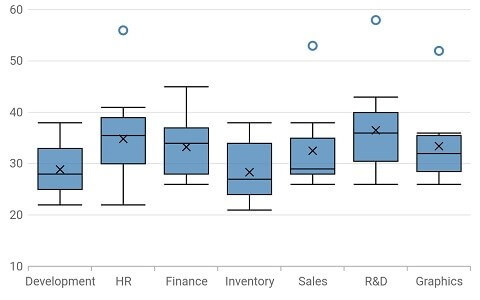
Box and whisker chart
The box and whisker chart is used to visualize a group of numerical data through its quartiles. It is also referred to as a box plot. Box plots may also have lines extending vertically from the boxes (whiskers) indicating variability outside the upper and lower quartiles.
Refer to the following code.
[Dart]
SfCartesianChart(
  series: <BoxAndWhiskerSeries<ChartData, String>>[
    BoxAndWhiskerSeries<ChartData, String>(
      dataSource: <ChartData>[
        ChartData('Development', [22, 22, 23, 25, 25, 25, 26, 27, 27]),
        ChartData('HR', [22, 24, 25, 30, 32, 34, 36, 38, 39, 41]),
        //...
      ],
      showMean: true,
      xValueMapper: (ChartData data, _) => data.x,
      yValueMapper: (ChartData data, _) => data.y
    ),
  ]
)
After executing this code example, we will get output like in the following screenshot.
UG link: https://help.syncfusion.com/flutter/cartesian-charts/chart-types#box-and-whisker-chart
SB sample link: https://flutter.syncfusion.com/#/cartesian-charts/chart-types/box-and-whisker/box-and-whisker-chart
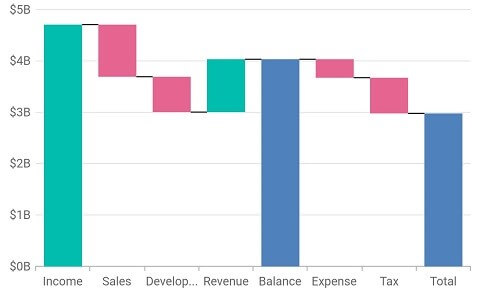
Waterfall chart
The waterfall chart shows gradual changes in the quantitative value of an entity that is subjected to changes by increments or decrements. Using the waterfall chart, you can quickly illustrate changes in revenue.
Refer to the following code.
[Dart]
SfCartesianChart(
  series: <ChartSeries<ChartData, double>>[
    WaterfallSeries<ChartData, double>(
      dataSource: <ChartData>[
        ChartData(2, 10),
        ChartData(3, -3),
        ChartData(4, 5, true),
        //...
        ChartData(13, -5, false, true),
      ],
      xValueMapper: (ChartData data, _) => data.x,
      yValueMapper: (ChartData data, _) => data.y,
      intermediateSumPredicate: (ChartData data, _) => data.isIntermediate,
      totalSumPredicate: (ChartData data, _) => data.isTotal,
      negativePointsColor: const Color.fromRGBO(229, 101, 144, 1),
      intermediateSumColor: const Color.fromRGBO(79, 129, 188, 1),
      totalSumColor: const Color.fromRGBO(79, 129, 188, 1),
      connectorLineSettings: WaterfallConnectorLineSettings(
        width: 2.5,
        dashArray: <double>[3, 1]
      )
    )
  ]
)
After executing this code example, we will get output like in the following screenshot.
UG link: https://help.syncfusion.com/flutter/cartesian-charts/chart-types#waterfall-chart
SB sample link: https://flutter.syncfusion.com/#/cartesian-charts/chart-types/waterfall/default-waterfall-chart
Feature enhancements
Exporting
A rendered chart can be exported and saved locally as a PNG image or PDF document for future use. The following code snippet shows exporting a chart as a PNG image.
[Dart]
dart_ui.Image data = await _cartesianKey.currentState.toImage(pixelRatio: 3.0);
final bytes = await data.toByteData(format: dart_ui.ImageByteFormat.png);
if (data != null) {
  await Navigator.of(context).push(
    MaterialPageRoute(
      builder: (BuildContext context) {
        return Scaffold(
          body: Center(
            child: Container(
              color: Colors.white,
              child: Image.memory(bytes.buffer.asUint8List()),
            )
          )
        );
      }
    )
  );
}
UG link – https://help.syncfusion.com/flutter/cartesian-charts/export-cartesian-chart
Trackball features
The trackball has the following new feature enhancements in this release.
Marker for trackball
The newly introduced trackball marker feature helps you indicate an exact data point location. You can also add a shape to adorn each data point when the trackball is visible. The trackball marker can be shown or hidden independently and also displayed based on the series marker’s visibility.
Refer to the following code.
[Dart]
SfCartesianChart(
  trackballBehavior: TrackballBehavior(
    enable: true,
    markerSettings: TrackballMarkerSettings(
      markerVisibility: TrackballVisibilityMode.visible
    )
  )
)
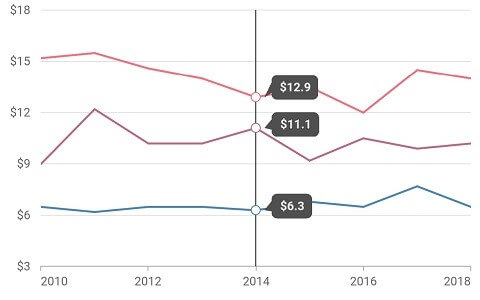
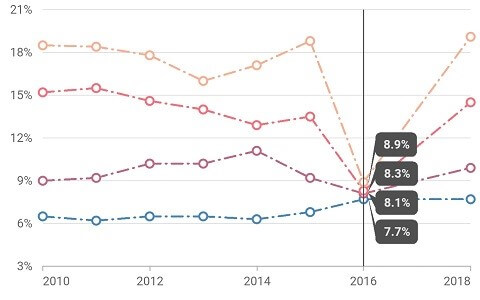
Trackball tooltip overlap
From this Volume 3 release onwards, if there are two or more series data points rendered close to each other, then the trackball tooltips of each data point will not overlap with each other. They will be repositioned automatically. No API is required to enable this feature.
Refer to the following screenshot.
UG link: https://help.syncfusion.com/flutter/cartesian-charts/trackball-crosshair#trackball
SB sample link: https://flutter.syncfusion.com/#/cartesian-charts/user-interactions/trackball/chart-with-trackball
Data label features
The data label feature has the following new enhancements in this release.
Padding for data labels
You can add padding to a data label to move it both vertically and horizontally from its initial position. Logical pixel value is provided as input.
Refer to the following code.
[Dart]
SfCartesianChart(
  series: <CartesianSeries<ChartData,num>>[
    SplineSeries<ChartData, num>(
      dataLabelSettings: DataLabelSettings(
        isVisible: true,
        offset: Offset(0, 30)
      )
    )
  ]
)
Refer to the following screenshot.
Data label tap callback
This is a callback event. It will be triggered when you tap on a data label of a data point in the series.
Refer to the following code.
[Dart]
SfCartesianChart(
  onDatalabelTapped: (DataLabelTapArgs args) {
    print(args.seriesIndex);
  },
  series: <ChartSeries<ChartData, DateTime>>[
    LineSeries<ChartData, DateTime>(
      dataLabelSettings: DataLabelSettings(
        isVisible: true
      )
    )
  ]
)
UG link: https://help.syncfusion.com/flutter/cartesian-charts/marker-datalabel#data-label
SB sample link: https://flutter.syncfusion.com/#/cartesian-charts/series-features/data-label/default-data-labels
Animate the series dynamically
You can perform initial rendering animation in an existing series by using this feature. On calling the animate method, a particular series will be animated based on the animationDuration property’s value in the series.
Refer to the following code.
[Dart]
Widget build(BuildContext context) {
    ChartSeriesController _chartSeriesController;
      return Column(
        children: <Widget>[
          Container(
            child: SfCartesianChart(
              series: <ChartSeries<ChartData, String>>[
                ColumnSeries<ChartData, String>(
                  animationDuration: 2000,
                  onRendererCreated: (ChartSeriesController controller) {
                    _chartSeriesController = controller;
                  }
                )
              ],
            )
          ),
          Container(
            child: RaisedButton(
                onPressed: () {
                  _chartSeriesController?.animate();
                },
                child: Text('Animate'),
            )
          ),
      );
    }
 SB sample link : https://flutter.syncfusion.com/#/cartesian-charts/series-features/animation/series-animation
Select the data points dynamically
The data points in a chart can be selected programmatically by passing the point index and series index values to the selectDataPoints method.
Refer to the following code.
[Dart]
SfCartesianChart chart;
SelectionBehavior selection;

@override
Widget build(BuildContext context) {
  selection = SelectionBehavior(enable: true);
  chart = SfCartesianChart(
    series: <CartesianSeries>[
      ColumnSeries<ChartData, double>(
        selectionBehavior: selection
      )
    ]
  );

  return Scaffold(
    body: Column(
      children: <Widget>[
        FlatButton(
          child: Text('Select'),
            onPressed: select
          ),
        Container(child: chart)
      ]
    )
  );
}

void select() {
  selection.selectDataPoints(1, 0);
}
 SB sample link: https://flutter.syncfusion.com/#/cartesian-charts/user-interactions/selection/dynamic-selection
Anchor range to data points
This new feature is used to determine the value of the axis range, based on the visible data points or based on the overall data points available in the chart. The visible data points can be changed on performing interactions like pinch zooming, selection zooming, and panning, and also on specifying visibleMinimum and visibleMaximum values.
Refer to the following code.
[Dart]
SfCartesianChart(
  primaryYAxis: NumericAxis(
    anchorRangeToVisiblePoints: true
  )
)
 SB sample link: https://flutter.syncfusion.com/#/cartesian-charts/user-interactions/zooming-and-panning/pinch-zooming
Breaking changes
The selectionSettings property and the SelectionSettings class have been deprecated. Now, you can use the selectionBehavior property and SelectionBehavior class, respectively, instead of them.
Refer to the following code.
[Dart]
SfCartesianChart(
  series: <CartesianSeries<ChartData, double>>[
    ColumnSeries<ChartData, double>(
      selectionBehavior: SelectionBehavior(
        // Enables selection
        enable: true
      )
    )
  ]
);
Conclusion
I hope you now have a clear idea of the various new features and enhancements available for the Syncfusion Flutter Charts widget in the 2020 Volume 3 release. For more details about the bug fixes and other enhancements, check out our release notes.
Browse our documentation to learn more about our Syncfusion Flutter widgets. You can also see Syncfusion’s Flutter app with many examples in this GitHub repo. Don’t miss our demo app in Google Play and the App Store.
If you aren’t a customer yet, you can try our 30-day free trial to check out these features.
Also, if you wish to send us feedback or would like to submit any questions, please feel free to post them in the comments section of this blog post. You can also contact us through our support forum, feedback portal, or Direct-Trac support system. We are always happy to assist you!


 No spam, just valuable updates.