

The Syncfusion Flutter Treemap is a data visualization widget. It visualizes flat and hierarchical data as tiles (rectangles) that are sized and colored based on the quantitative values. Its features include data binding, legends, data labels, tooltips, color mapping, layout types, drill-down, and more. This blog post explores the step-by-step process of how to visualize election results using the Flutter Treemap widget.
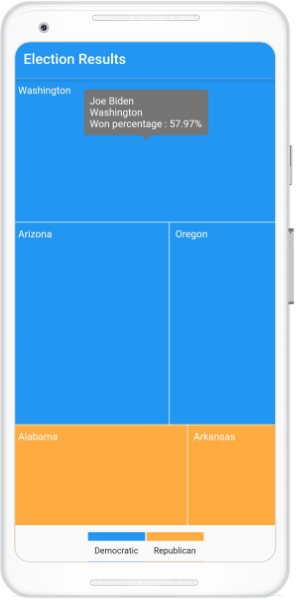
We are going to render a Treemap representing the presidential election of the United States with tiles, legends, a tooltip, and two different colors to represent the candidates. The following GIF image depicts the Treemap we will build in this blog.
Note: The Treemap information is sourced from the 2020 United States presidential election.
In the above GIF image, the tile size is calculated based on the population (voter count) of the state, and the color is applied based on the winner of that state. The tooltip displays the candidate’s name, state, and vote percentage details.
Installation and configuration
Follow these steps to install and configure the Flutter Treemap widget in your application:
- First, create a simple project using the instructions given in the Getting Started with your first Flutter app documentation.
- Then, add the Syncfusion Flutter Treemap dependency to your pubspec.yaml file with the current version of the Syncfusion Flutter Treemap package.
Refer to the following code.dependencies:
syncfusion_flutter_treemap: ^xx.x.xx
- Now, import the library using the following code.
import 'package:syncfusion_flutter_treemap/treemap.dart';
Populate data source and initialize the Treemap
Follow these steps to populate the election results in the Flutter Treemap:
- We are going to display the results for each state in the U.S.A. Thus, the Treemap should have a tile (rectangle) for each state. So, we have to set the number of states in the U.S.A as the value for the dataCount property.
- The next thing the Treemap needs to know is the size of each tile. In an election result, the tile size represents the population (voters) of each state. So, we have to return the voters count in each state from the weightValueMapper callback of the Treemap.
- Now, group the election results in order of the state in the Flutter Treemap. Return the state name from the groupMapper callback. You can have more than one TreemapLevel in the levels collection to form a hierarchical Treemap. As this election result is a flat structure, we have only one TreemapLevel.Refer to the following code snippet. Here, we have taken the details of only five states from the data source to provide better readability.
late List<_StateElectionDetails> _stateWiseElectionResult;

  @override
  void initState() {
    // Define the data source.
    _stateWiseElectionResult = <_StateElectionDetails>[
      const _StateElectionDetails(
          state: 'Washington',
          candidate: 'Joe Biden',
          party: 'Democratic',
          totalVoters: 4087631,
          votes: 2369612,
          percentage: 57.97),
      const _StateElectionDetails(
          state: 'Oregon',
          candidate: 'Joe Biden',
          party: 'Democratic',
          totalVoters: 2374321,
          votes: 1340383,
          percentage: 56.45),
      const _StateElectionDetails(
          state: 'Alabama',
          candidate: 'Donald Trump',
          party: 'Republican',
          totalVoters: 2323282,
          votes: 1441170,
          percentage: 62.03),
      const _StateElectionDetails(
          state: 'Arizona',
          candidate: 'Joe Biden',
          party: 'Democratic',
          totalVoters: 3387326,
          votes: 1672143,
          percentage: 49.36),
      const _StateElectionDetails(
          state: 'Arkansas',
          candidate: 'Donald Trump',
          party: 'Republican',
          totalVoters: 1219069,
          votes: 760647,
          percentage: 62.40),
    ];

    super.initState();
  }

  @override
  Widget build(BuildContext context) {
    return Padding(
      padding: const EdgeInsets.all(10.0),
      child: SfTreemap(
        // Set the data source length.
        dataCount: _stateWiseElectionResult.length,
        // Return the population of the state
        weightValueMapper: (int index) {
          return _stateWiseElectionResult[index].totalVoters;
        },
        levels: [
          TreemapLevel(
            // Update the group mapper
            groupMapper: (int index) => _stateWiseElectionResult[index].state,
          ),
        ],
      ),
    );
  }
After executing this code, we will get output like in the following screenshot.

Enable the labels to identify the states in tiles
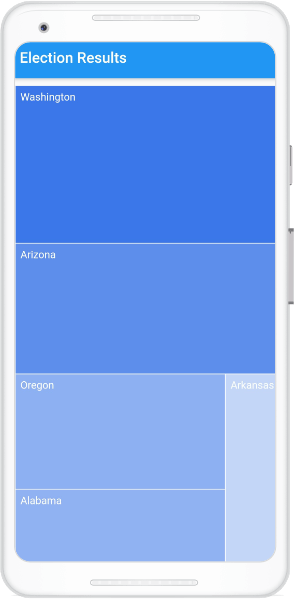
In the previous Treemap, it is unclear that which tile belongs to which state. The rescue comes through the labels feature, through which we are going to put the state names in the tiles. To do so, return the text widget from the labelBuilder callback.
Refer to the following code example.
@override
  Widget build(BuildContext context) {
    return Padding(
      padding: const EdgeInsets.all(10.0),
      child: SfTreemap(
        dataCount: _stateWiseElectionResult.length,
        weightValueMapper: (int index) {
          return _stateWiseElectionResult[index].totalVoters;
        },
        levels: [
          TreemapLevel(
            groupMapper: (int index) => _stateWiseElectionResult[index].state,

            // Write the state name in each tile.
            labelBuilder: (BuildContext context, TreemapTile tile) {
              return Padding(
                padding: const EdgeInsets.all(8.0),
                child: Text(
                  tile.group,
                  style: TextStyle(color: Colors.white),
                ),
              );
            },
          ),
        ],
      ),
    );
  }
After executing this code, we will get the output like in the following screenshot.
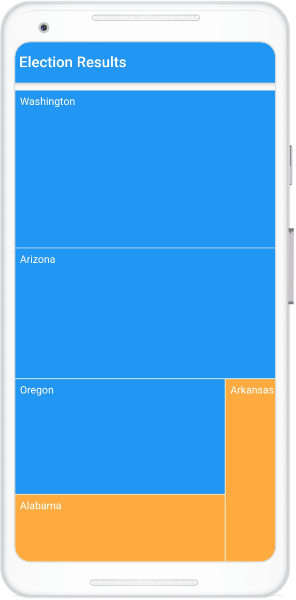
Update the tile color based on the winning party
So, everything works as expected. Next, we are going to change the tile color based on the winning candidate in that state (tile). To do this, update the TreemapColorMapper collection to the Treemap’s colorMappers property. Then, update the Treemaplevel’s colorValueMapper property.
Refer to the following code example.
late List _colorMappers;

@override
  void initState() {

    //Update the data from previous code example for data source.
    _stateWiseElectionResult = <_StateElectionDetails>[];

    //Define the color values for both parties.
    _colorMappers = [
      const TreemapColorMapper.value(value: 'Democratic', color: Colors.blue),
      const TreemapColorMapper.value(
          value: 'Republican', color: Colors.orangeAccent),
    ];

    super.initState();
}

  @override
  Widget build(BuildContext context) {
    return Padding(
      padding: const EdgeInsets.all(10.0),
      child: SfTreemap(
        dataCount: _stateWiseElectionResult.length,
        weightValueMapper: (int index) {
          return _stateWiseElectionResult[index].totalVoters;
        },
        colorMappers: _colorMappers,
        levels: [
          TreemapLevel(
            groupMapper: (int index) => _stateWiseElectionResult[index].state,
            labelBuilder: (BuildContext context, TreemapTile tile) {
              return Padding(
                padding: const EdgeInsets.all(8.0),
                child: Text(
                  tile.group,
                  style: TextStyle(color: Colors.white),
                ),
              );
            },

            //Update the title color to represent the winning party.
            colorValueMapper: (TreemapTile tile) {
              return _stateWiseElectionResult[tile.indices[0]].party;
            },
          ),
        ],
      ),
    );
  }
After executing this code, we will get output like in the following screenshot.
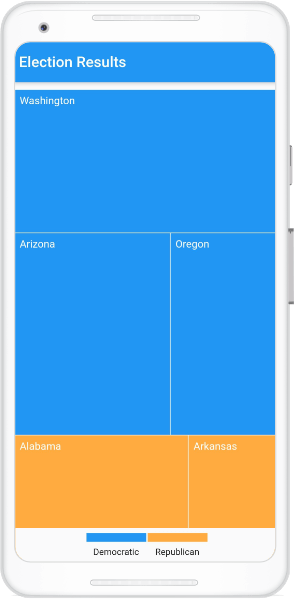
Adding a legend to the Treemap
By default, the legend items’ text is rendered based on the value of the TreemapLevel.groupMapper property, which we have already defined. So, just setting the position and size of the legend is enough.
Refer to the following code example to add a legend to identify the parties based on color.
@override
  Widget build(BuildContext context) {
    return Padding(
      padding: const EdgeInsets.all(10.0),
      child: SfTreemap(
        dataCount: _stateWiseElectionResult.length,
        weightValueMapper: (int index) {
          return _stateWiseElectionResult[index].totalVoters;
        },
        colorMappers: _colorMappers,
        levels: [
          TreemapLevel(
            groupMapper: (int index) => _stateWiseElectionResult[index].state,
            labelBuilder: (BuildContext context, TreemapTile tile) {
              return Padding(
                padding: const EdgeInsets.all(8.0),
                child: Text(
                  tile.group,
                  style: TextStyle(color: Colors.white),
                ),
              );
            },
            colorValueMapper: (TreemapTile tile) {
              return _stateWiseElectionResult[tile.indices[0]].party;
            },
          ),
        ],

        // Enable the legend
        legend: TreemapLegend.bar(
          position: TreemapLegendPosition.bottom,
          segmentSize: const Size(80.0, 12.0),
        ),
      ),
    );
  }
After executing this code, we will get output like in the following screenshot.
Enable the tooltip
You can enable the tooltips to display additional information about the tiles when the pointer hovers over them or on tap events. For this, return a widget in the TreemapLevel.tooltipBuilder method. This widget will then be wrapped in the built-in shape that comes with the pointer at the bottom.
Refer to the following code.
  @override
  Widget build(BuildContext context) {
    return Padding(
      padding: const EdgeInsets.all(10.0),
      child: SfTreemap(
        dataCount: _stateWiseElectionResult.length,
        weightValueMapper: (int index) {
          return _stateWiseElectionResult[index].totalVoters;
        },
        colorMappers: _colorMappers,
        levels: [
          TreemapLevel(
              groupMapper: (int index) => _stateWiseElectionResult[index].state,
              labelBuilder: (BuildContext context, TreemapTile tile) {
                return Padding(
                  padding: const EdgeInsets.all(8.0),
                  child: Text(
                    tile.group,
                    style: TextStyle(color: Colors.white),
                  ),
                );
              },

              colorValueMapper: (TreemapTile tile) {
                return _stateWiseElectionResult[tile.indices[0]].party;
              },

              // Enable the tooltip.
              tooltipBuilder: (BuildContext context, TreemapTile tile) {
                return Padding(
                  padding: const EdgeInsets.all(8.0),
                  child: RichText(
                      text: TextSpan(
                          text: _stateWiseElectionResult[tile.indices[0]]
                              .candidate,
                          children: [
                        TextSpan(
                              text: '\n${tile.group}',
                            ),

                        TextSpan(
                          text: '\nWon percentage : ' +
                              _stateWiseElectionResult[tile.indices[0]]
                                  .percentage
                                  .toString() +
                              '%',
                        ),
                      ])),
                );
              }),
        ],

        legend: TreemapLegend.bar(
          position: TreemapLegendPosition.bottom,
          segmentSize: const Size(80.0, 12.0),
        ),
      ),
    );
  }
After executing this code, we will get the output like in the following screenshot.
Resource
For more information, refer to the Visualize Election Results with Flutter Treemap demo.
Conclusion
Thanks for reading! In this blog, we have seen how to visualize election results using the Syncfusion Flutter Treemap widget. With this widget, you can also visualize literacy rates, weather reports, and more with the versatile and colorful features in it. To learn more, you can also check out our Flutter Treemap widget’s user guide and example projects. Try out the steps given in this blog post and leave your feedback in the comments section of this blog post!
Don’t miss our demo app in Google Play, the App Store, the Windows Store, the App Center, Snapcraft, and on our website.
You can contact us through our support forum, Direct-Trac, or feedback portal. As always, we are happy to assist you!


 No spam, just valuable updates.