
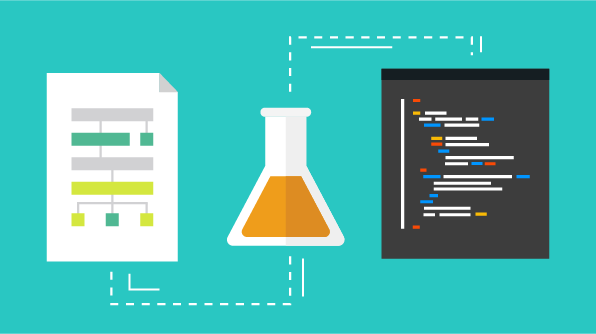
In the whitepaper “10 Myths About Data Science” Syncfusion published in September, you learned that data science is, first and foremost, a process. Although there’s no solid definition of data science, many experts agree on this much, at least. But what is this process?
Similar to most science, it starts with the formation of a hypothesis. To begin the data science process, you must first understand the problem you are trying to solve. Quiz those asking you to solve the problem for details, and try to convert that information into data science-friendly questions. Then you can form a measurable hypothesis, or set of hypotheses, to focus your research. What is the most likely result of this inquiry?
Using a hypothesis will also help you figure out what kind of data you need; data that will lead you to reject or fail to reject the hypothesis. Now you need to figure out how you are going to collect this data. Usually, the data is already out there, so you need to assess what it takes to acquire it. Find out if it’s expensive, who you need to work with for permission, whether there are legal issues, what kind of anonymization you’ll need to do on the data, and so on.
When you have collected your data, you need to store it in a useable way, and then prep it for analysis, or “wrangle” it. According to studies, this is the most time-consuming part of data science, taking up 60% of a data scientist’s time. Data analysis is effective when it is run on data that is in uniform format, which is not what you get when collecting data from multiple data sources. This is where software tools like Syncfusion’s Data Integration and Big Data Platforms can help you manage your data more quickly. You’ll also need to clean up typos, fields that may have caused misinterpretation and therefore unreliable answers, corrupt or incomplete records, and correct other errors.
From here, you’ll need to step back and look at your clean data, then build and validate a data model to test your hypothesis. This is where you can get fancy with your statistical analyses, algorithms, and such. Of course, at any point in this process, you may need to restart it or jump back a step based on your findings.
Once you have rejected or failed to reject your hypothesis (or hypotheses), you must then make your information accessible to others by visualizing it in charts, graphs, or other formats, and then help them interpret it through what is known as data storytelling. Your insights mean little if you can’t communicate them to decision makers. This is where tools like the Syncfusion Dashboard and Reporting Platforms can speed things up and make your results visually impressive for your presentation.
If you missed the whitepaper detailing how data science can benefit your company, and the equipment and expertise required to implement it to your best advantage, check it out here.
 No spam, just valuable updates.