

A heat map is a visual representation of data over time. Heat maps are widely used in various fields, including finance, healthcare, and education. Colors in a heat map represent a range of values, such as a user’s activity level throughout the day or week.
Using a heat map on a calendar, users can quickly determine which days are typically busier. This information can be used to modify their schedule or organize their work more efficiently.
This blog post will explore designing a heat map calendar using the .NET MAUI Scheduler. In this example, we will use the Scheduler to track daily support ticket traffic. Support traffic refers to the volume of requests for information or problem fixes a company or organization receives. The Syncfusion .NET MAUI Scheduler provides customization options and allows users to design a heat map calendar by customizing the month cells.

Note: If you are new to our .NET MAUI Scheduler control, please refer to its getting started documentation before proceeding.
Choosing a color scheme to visualize support traffic
In this example, we chose a sequential color scheme, which uses a range of colors from light to dark to represent increasing values. The color scheme uses increasingly dark shades of blue to represent increasing numbers of support requests. This can help clarify the information presented in the heat map.

Importing the support data to the Scheduler
Import the support data to the Scheduler in the following steps:
- Create the support data model.
- Create the support data collection.
- Map the support data to the Scheduler.
Create the support data model
We first need to define a data model that includes the necessary support details, such as the date of the support request and the corresponding request count.
public class SupportDetails
{
    /// <summary>
    /// Date of the support detail.
    /// </summary>
    public DateTime Date { get; set; }

    /// <summary>
    /// Support count for the date.
    /// </summary>
    public int Value { get; set; }
}
Create the support data collection
Support traffic details can be stored in various formats, depending on your organization’s available resources and tools. For demonstration purposes, we have manually provided support data for the last 100 days, which will be used to render the month cell background color in the Scheduler.
public class HeatmapViewModel
{
    public List<SupportDetails> SupportDetails { get; set; }

    public DateTime MaxDate { get; set; }

    public HeatmapViewModel()
    {
        this.MaxDate = DateTime.Today;
        this.GenerateSupportDetails();
    }

    private void GenerateSupportDetails()
    {
        this.SupportDetails = new List<SupportDetails>();
        for (int startDate = -100; startDate <= 0; startDate++)
        {
            DateTime date = DateTime.Today.AddDays(startDate);
            int supportCount = this.GetSupportCount(date);
            SupportDetails supportDetails = new SupportDetails()
            {
                Date = date,
                SupportCount = supportCount
            };
            this.SupportDetails.Add(supportDetails);
        }
    }

    private int GetSupportCount(DateTime date)
    {
        if (date.Month % 2 == 0)
        {
            if (date.Day % 6 == 0)
            {
                // 6, 12, 18, 24, 30
                return 2248;
            }
            else if (date.Day % 5 == 0)
            {
                // 5, 10, 15, 20, 25
                return 1364;
            }
            else if (date.Day % 4 == 0)
            {
                //  4, 8, 16, 24, 28
                return 1976;
            }
            else if (date.Day % 3 == 0)
            {
                // 3, 9, 18, 21, 27
                return 417;
            }
            else
            {
                // 1, 2, 7, 11, 13, 19, 22, 23, 26, 29
                return 891;
            }
        }
        else
        {
            if (date.Day % 6 == 0)
            {
                // 6, 12, 18, 24, 30
                return 891;
            }
            else if (date.Day % 5 == 0)
            {
                // 5, 10, 15, 20, 25
                return 417;
            }
            else if (date.Day % 4 == 0)
            {
                //  4, 8, 16, 24, 28
                return 1364;
            }
            else if (date.Day % 3 == 0)
            {
                // 3, 9, 18, 21, 27
                return 2248;
            }
            else
            {
                // 1, 2, 7, 11, 13, 19, 22, 23, 26, 29
                return 1976;
            }
        }
    }
}
Map the support data to the Scheduler
To link the custom support data object to the Scheduler, configure the AppointmentMapping property in it. Once the mapping is complete, assign the collection of support data objects to the AppointmentsSource property.
This generates the appointment details in the MonthCell, which displays the support traffic details for each day. The background color of the MonthCell is determined based on the number of support tickets received on that day.
<schedule:SfScheduler x:Name="Scheduler" View="Month" AppointmentsSource="{Binding SupportDetails}" MaximumDateTime="{Binding MaxDate}" CellBorderBrush="Transparent">
 <schedule:SfScheduler.AppointmentMapping>
  <schedule:SchedulerAppointmentMapping StartTime="Date" EndTime="Date"/>
 </schedule:SfScheduler.AppointmentMapping>
Designing the heat map calendar
Designing a heat map calendar involves visualizing data in a calendar format, where each cell represents a day, and the background color represents the data’s intensity or value.
In the Syncfusion .NET MAUI Scheduler, you can customize the month cell’s appearance based on data using the CellTemplate property in CalendarMonthView. To avoid appointments rendering on the month cells, set the AppointmentDisplayMode property in CalendarMonthView to None.
Refer to the following code to design a heat map calendar using the CellTemplate in CalendarMonthView.
<schedule:SfScheduler x:Name="Scheduler" View="Month" AppointmentsSource="{Binding SupportDetails}" MaximumDateTime="{Binding MaxDate}" CellBorderBrush="Transparent">
 <schedule:SfScheduler.AppointmentMapping>
  <schedule:SchedulerAppointmentMapping StartTime="Date" EndTime="Date"/>
 </schedule:SfScheduler.AppointmentMapping>
 <schedule:SfScheduler.MonthView>
  <schedule:SchedulerMonthView AppointmentDisplayMode="None" ShowLeadingAndTrailingDates="False">
   <schedule:SchedulerMonthView.CellTemplate>
    <DataTemplate>
     <Grid x:Name="cellGrid" Background="{Binding Appointments, Converter={StaticResource colorConverter}}" Margin="0.25">
      <Label Text="{Binding DateTime.Day}" HorizontalTextAlignment="Center" VerticalTextAlignment="Center" TextColor="{Binding Appointments, Converter={StaticResource textColorConverter}}">
      </Label>
     </Grid>
    </DataTemplate>
   </schedule:SchedulerMonthView.CellTemplate>
  </schedule:SchedulerMonthView>
 </schedule:SfScheduler.MonthView>
</schedule:SfScheduler>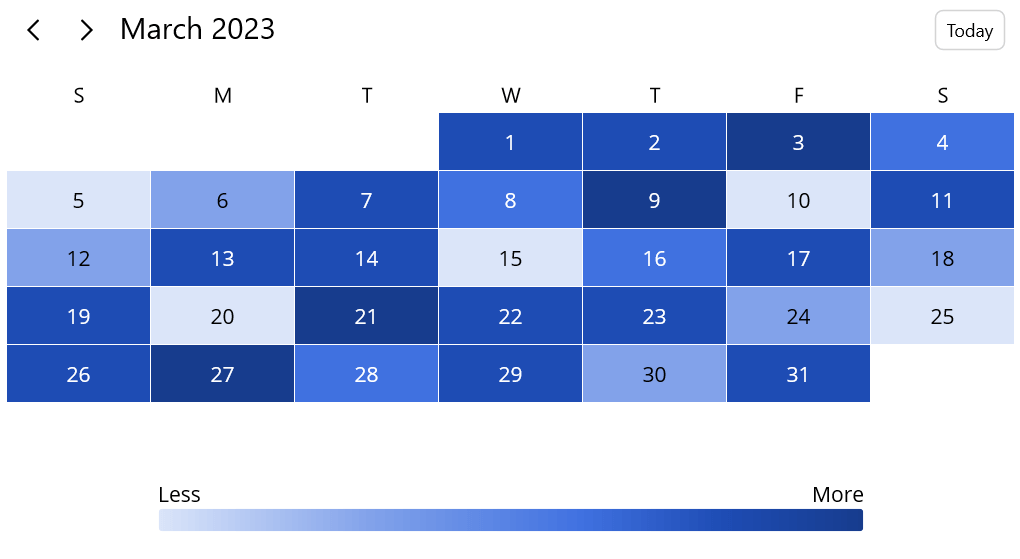
GitHub reference
For more information, refer to designing a heat map using the .NET MAUI Scheduler demo.
Conclusion
Thank you for your time! This blog post briefly overviewed designing a heat map calendar using the Syncfusion .NET MAUI Scheduler. With it, you can create visually stunning and highly functional heat map calendars that provide valuable insights into complex data sets.
Check out our other .NET MAUI controls and demos on GitHub and share your feedback or ask questions in the comments section below.
If you are not a Syncfusion customer, try our 30-day free trial to see how our components can enhance your projects.
You can also reach us through our support forum, support portal, or feedback portal. We are always happy to assist you!


 No spam, just valuable updates.