
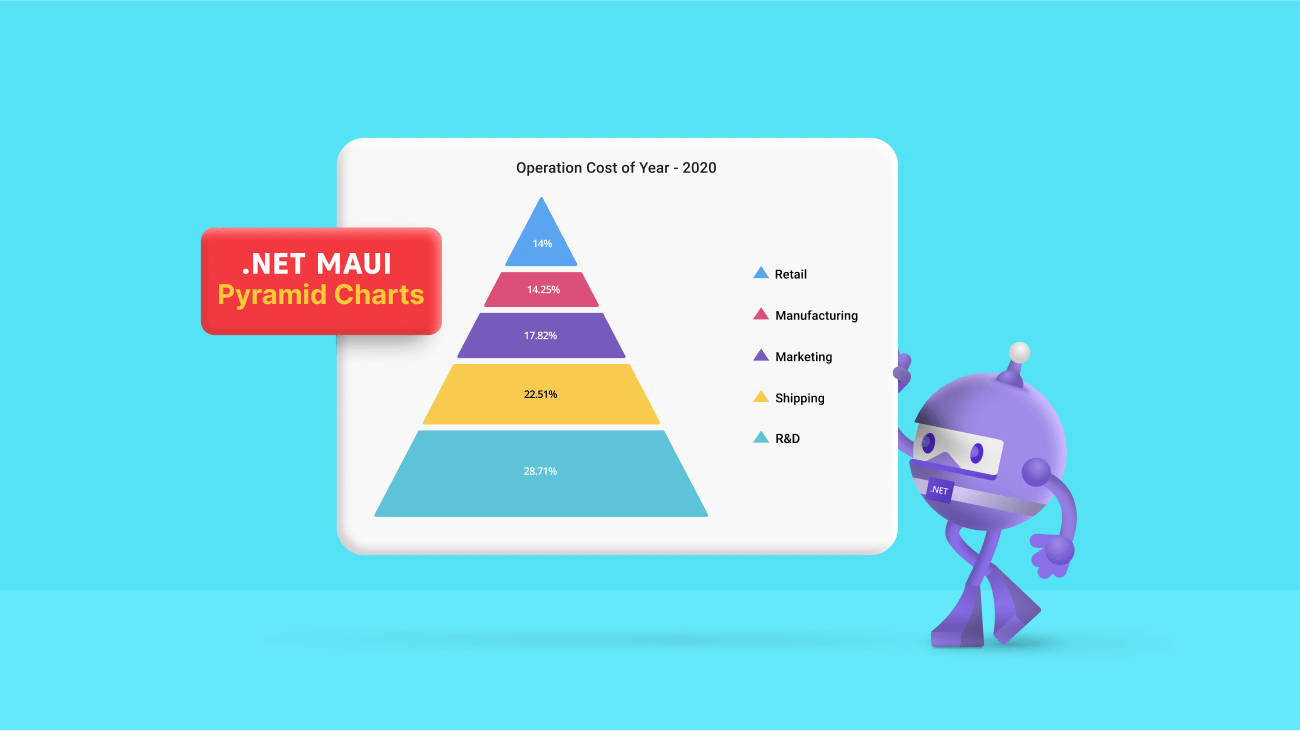
In Essential Studio® 2022 Volume 4, we have added one more data visualization tool to the Syncfusion .NET MAUI suite, the Pyramid Charts.
The new .NET MAUI Pyramid Charts is a powerful data visualization tool. It allows developers to concisely show hierarchical relationships among data. It is an excellent choice for displaying data hierarchies, such as showing the division of a total into its parts or visualizing the composition of a population.
In this blog, we will explore the features of the new .NET MAUI Pyramid Charts and the steps to get started with it.
Features of .NET MAUI Pyramid Charts
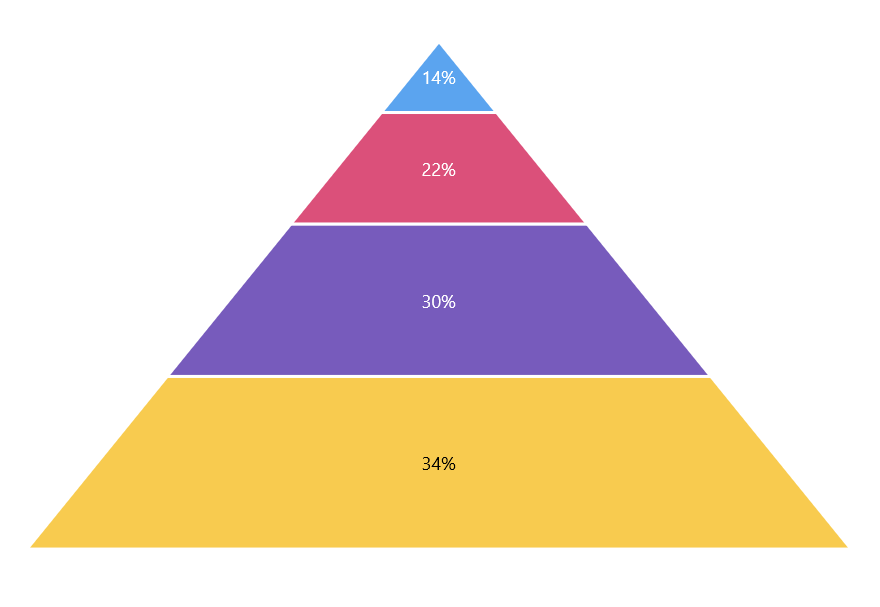
Data labels
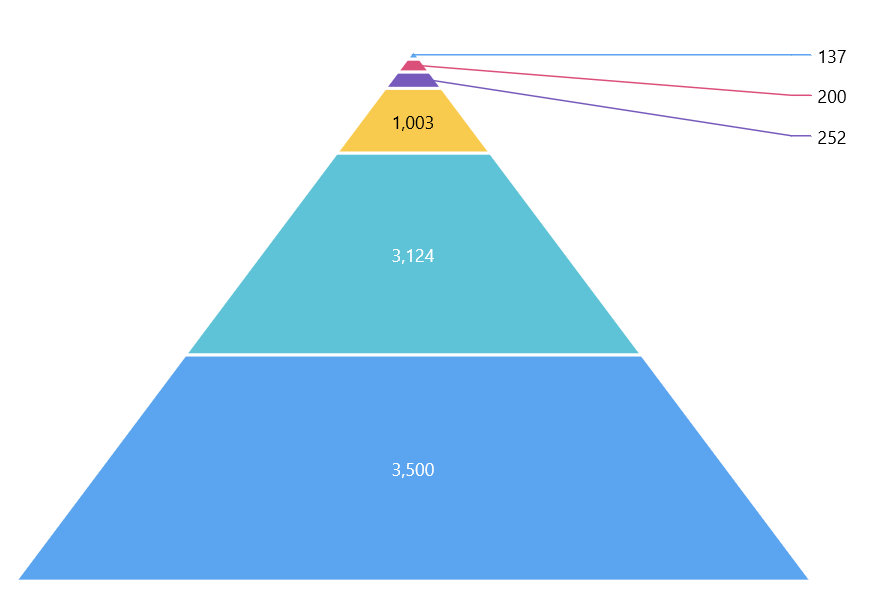
You can display data labels with various placement options in the Pyramid Charts. Place the data labels inside or outside of the pyramid segments. This makes it easy to focus on the significant information and quickly identify the breakdown.
In space-constrained scenarios, the data labels smartly align themselves based on the available space, thus improving the user experience and readability.
Tooltip
Use the tooltip feature to display more information about data points while hovering over them. By default, the tooltip displays the value (y–value) of each segment of the pyramid.
With the help of the TooltipTemplate support, we can customize tooltips to show different information using any .NET MAUI view control.
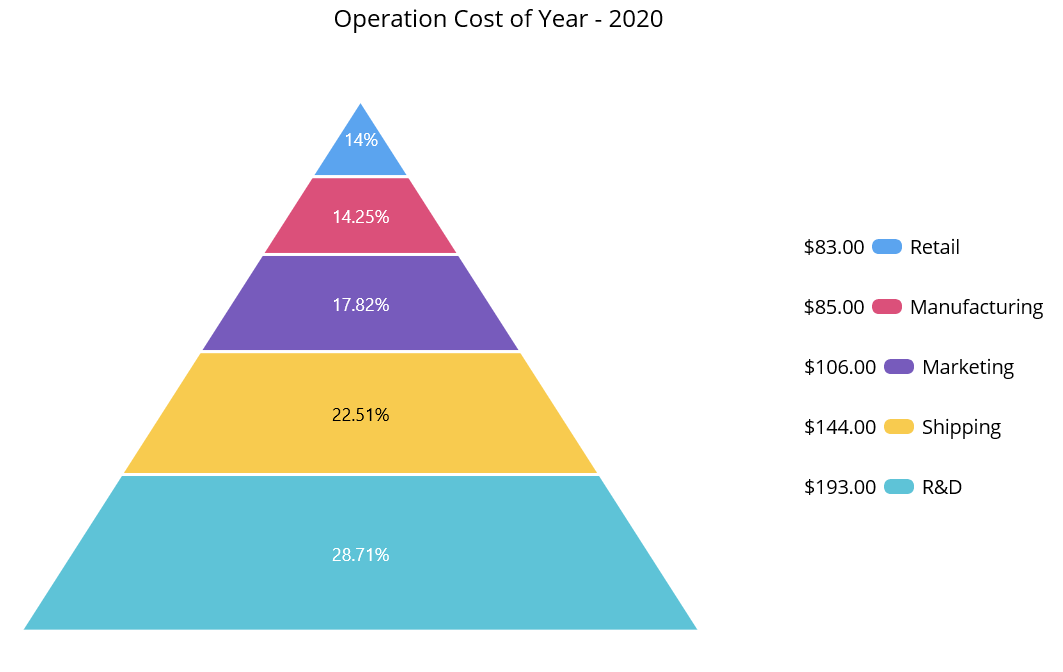
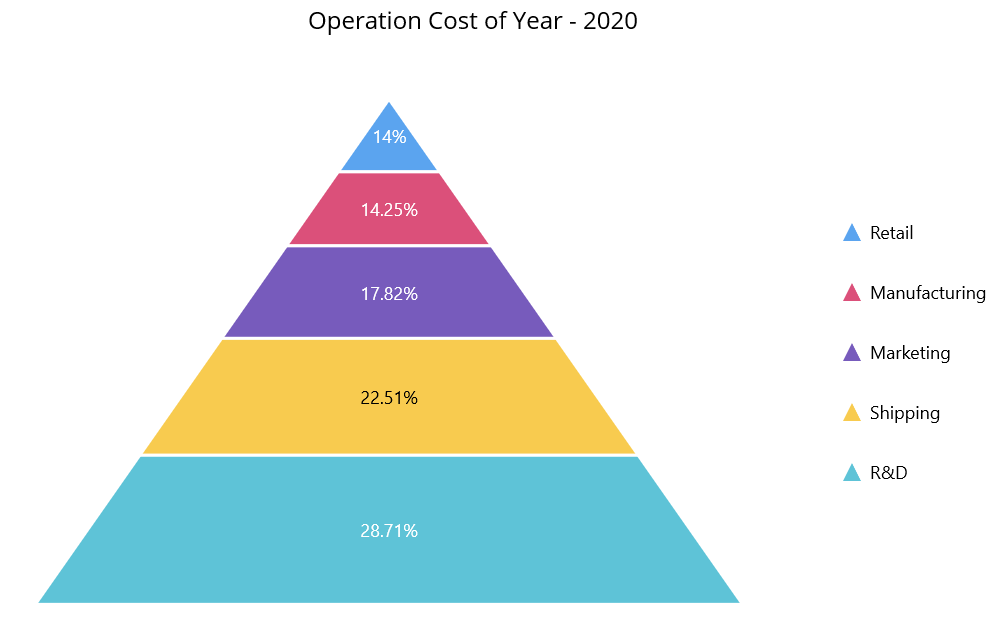
Legend
Render a legend next to your Pyramid Charts. By default, the legend items will appear with the names of the pyramid segments. You can customize the legend with any .NET MAUI view control using the ItemTemplate support.
Note: Refer to the .NET MAUI Pyramid Charts documentation to know its other available features.
Getting started with .NET MAUI Pyramid Charts
This section explains the steps to getting started with the new .NET MAUI Pyramid Charts and populating it with data.
Step #1: First, create a simple .NET MAUI project.
Step #2: The Syncfusion .NET MAUI controls are available on the NuGet Gallery. To add the SfPyramidChart to your project, open the NuGet package manager in Visual Studio. Search for Syncfusion.Maui.Charts and then install it.
Step #3: Then, register the handler for Syncfusion core in the MauiProgram.cs file. Refer to the following code.
public static class MauiProgram
{
  public static MauiApp CreateMauiApp()
  {
    var builder = MauiApp.CreateBuilder();
    builder
       .UseMauiApp<App>()
       .ConfigureSyncfusionCore()
       .ConfigureFonts(fonts =>
       {
          fonts.AddFont("OpenSans-Regular.ttf", "OpenSansRegular");
          fonts.AddFont("OpenSans-Semibold.ttf", "OpenSansSemibold");
       });
    builder.ConfigureSampleBrowserBase();
    return builder.Build();
  }
}
Step #4: Next, import the Syncfusion.Maui.Charts namespace on your XAML page.
xmlns:chart= “clr-namespace:Syncfusion.Maui.Charts;assembly=Syncfusion.Maui.Charts”
Step #5: Initialize an empty Pyramid Charts control like in the following code.
<chart:SfPyramidChart/>
Step #6: Create a business model to populate items in the Pyramid Charts. This includes the creation of the example ChartDataModel class and ChartViewModel with the list of data objects.
public class ChartDataModel
{
   public string ProgressName { get; set; }
   public double Value { get; set; }
}
public class ChartViewModel
{
   public ObservableCollection<ChartDataModel> Data { get; set; }
   public ChartViewModel()
   {
     Data = new ObservableCollection<ChartDataModel>
     {
        new ChartDataModel("Retail",14),
        new ChartDataModel("Manufacturing",14.25),
        new ChartDataModel("Marketing",17.82),
        new ChartDataModel("Shipping",22.51),
        new ChartDataModel("R&D",28.71)
    };
  }
}
Step #7: Finally, set the BindingContext to the ChartViewModel. Bind the data to the Pyramid Charts’ ItemsSource property. Then, bind the ProgressName and Value properties with the XBindingPath, and YBindingPath properties, respectively.
Refer to the following code example.
<chart:SfPyramidChart ItemsSource="{Binding Data}"
                      XBindingPath="ProgressName"
                      YBindingPath="Value">
   <chart:SfPyramidChart.BindingContext>
     <local:ChartViewModel/>
   </chart:SfPyramidChart.BindingContext>
</chart:SfPyramidChart>
After executing these code samples, we will get output like the following image.

Conclusion
Thanks for reading! In this blog, we have seen the features of the new .NET MAUI Pyramid Charts, rolled out in the 2022 Volume 4 release. Try out this stunning data visualization control and leave your feedback in the comment section below!
Check out our Release Notes and the What’s New pages to see the other updates in this release.
For questions, you can reach us through our support forums, support portal, or feedback portal. We are always happy to assist you!


 No spam, just valuable updates.