

TL;DR: Learn how to create interactive diagrams in Blazor apps using a powerful Diagram component that supports customizable shapes, connectors, and annotations. This guide demonstrates building a flowchart for a malfunctioning lamp scenario, enhancing your Blazor application’s functionality and user experience.
In general, creating a Blazor server app requiring instant server-side updates on each mouse twitch is very difficult. These are apps like real-time games or drawing apps. However, Syncfusion’s rich, interactive Diagram component is built to handle a high rate of interactions in Blazor applications.
The Blazor Diagram is a feature-rich component for creating or visualizing interactive diagrams. It allows users to create flow charts, organizational charts, mind maps, and BPMN diagrams using C# code or a visual interface with seamless interaction and editing capabilities.
Features
- Easily create desired diagrams using built-in shapes(nodes) with customizable appearances. You can also create custom shapes and add them to the symbol palette.
- Connect shapes by using straight, orthogonal, and curved arrow (connectors) types. Arrow heads and line styles are customizable.
- Clearly specify how connectors links with one another using bridging(line jumps). The line jump appearance and size are customizable.
- Define ports(connection points) to shapes, which helps keeping the connector glued to a specific point on the shape.
- Add text (annotations) to shapes and connectors, and edit them as needed. The alignment of text is customizable.
- Utilize various types of automatic layouts for real-time business objects such as organizational charts and mind maps. These are available with customizable layout, spacing, orientation, and assistance.
- Select one or more nodes or connectors and rotate them from 0 to 360 degrees. The selected items can be resized in eight different directions with or without respect to their aspect ratio.
- Cut, copy, paste, or duplicate selected objects within and across diagrams. You can also trigger these diagramming features using keyboard shortcuts.
- Use built-in APIs for undo and redo actions to correct recent changes. Group and ungroup multiple diagram elements as a single object.
- Get an overall outline of a diagram with the overview Zooming and panning features allow navigation to any part of a drawing to examine a specific part of complex diagrams.
- When you move a shape, the snap functionality pulls it and its edges into a position aligned with other shapes, ruler subdivisions, grid lines, guides, or guide points.
- Store and reopen any diagram with JSON serialization and deserialization.
How to create a simple, interactive diagram
Let’s see how to create a simple flowchart diagram in a Blazor application. You can find more information about how to create nodes and connectors with labels and their customization.
Create node
Create and add a node with a specific position, size, label, and shape with the following code.
@using Syncfusion.Blazor.Diagram
<SfDiagramComponent Width="100%" Height="700px" Nodes="@NodeCollection">
</SfDiagramComponent>
@code
{
//Defines diagram's nodes collection
public DiagramObjectCollection<Node> NodeCollection { get; set; } = new DiagramObjectCollection<Node>();
protected override void OnInitialized()
{
//Create nodes with specified information, offset, and dimensions
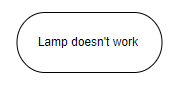
CreateNode("node1", 300, 80, 145, 60, NodeFlowShapes.Terminator, "Lamp doesn't work");
}
private void CreateNode(string id, double x, double y, double width, double height, NodeFlowShapes shape, string label)
{
ShapeAnnotation annotation = new ShapeAnnotation()
{
//Specify the additional information to the shape
Content = label
};
Node diagramNode = new Node()
{
//Specify the information, offset, and dimensions
ID = id,
OffsetX = x,
OffsetY = y,
Width = width,
Height = height,
Shape = new FlowShape() { Type = NodeShapes.Flow, Shape = shape },
Annotations = new DiagramObjectCollection<ShapeAnnotation>() { annotation }
};
//Add the diagram node to observable collection
NodeCollection.Add(diagramNode);
}
}
The previous code will create a node shown in the following screenshot.
Create connector
Create another node and a connector to connect the two nodes using the following code example.
@code
{
//Defines diagram's connector collection
public DiagramObjectCollection<Connector> ConnectorCollection { get; set; } = new DiagramObjectCollection<Connector>();
protected override void OnInitialized()
{
//Create nodes with specified information, offset, and dimensions
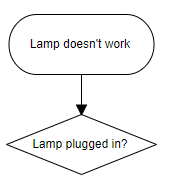
CreateNode("node1", 300, 80, 145, 60, NodeFlowShapes.Terminator, "Lamp doesn't work");
CreateNode("node2", 300, 180, 150, 60, NodeFlowShapes.Decision, "Lamp plugged in?");
//Create Connectors
CreateConnector("node1", "node2", "");
}
private void CreateConnector(string sourceId, string targetId, string label)
{
Connector diagramConnector = new Connector()
{
// Specify the source and target node for the connector
SourceID = sourceId,
TargetID = targetId
};
// Specify the additional information to the connector
PathAnnotation annotation = new PathAnnotation()
{
Content = String.IsNullOrEmpty(label) ? "" : label,
Style = new TextStyle() { Fill = "white" }
};
diagramConnector.Annotations = new DiagramObjectCollection<PathAnnotation>() { annotation };
ConnectorCollection.Add(diagramConnector);
}
}The previous code will create a node and connector as shown in the following screenshot.
Create a flowchart
Let us add nodes and connector to create a simple flowchart representing the process for dealing with a malfunctioning lamp with the following code example.
protected override void OnInitialized()
{
    //Create Nodes with specified information, offset, and dimensions.
    CreateNode("node1", 300, 80, 145, 60, NodeFlowShapes.Terminator, "Lamp doesn't work");
    CreateNode("node2", 300, 180, 150, 60, NodeFlowShapes.Decision, "Lamp plugged in?");
    CreateNode("node3", 480, 180, 145, 60, NodeFlowShapes.Terminator, "Plug in lamp");
    CreateNode("node4", 300, 280, 150, 60, NodeFlowShapes.Decision, "Bulb burned out?");
    CreateNode("node5", 480, 280, 145, 60, NodeFlowShapes.Terminator, "Replace bulb");
    CreateNode("node6", 300, 380, 145, 60, NodeFlowShapes.Terminator, "Repair lamp");

    //Create Connectors
    CreateConnector("node1", "node2", "");
    CreateConnector("node2", "node3", "No");
    CreateConnector("node2", "node4", "Yes");
    CreateConnector("node4", "node5", "Yes");
    CreateConnector("node4", "node6", "No");

    InitPaletteModel();
}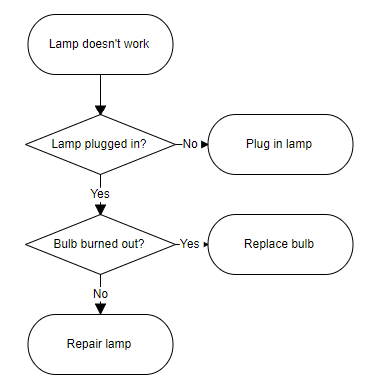
Finally, the simple flowchart will be created like in the following.
You can also create the same flow diagram by dragging the flow shapes from symbol palette.
Conclusion
I hope you are excited to create and edit diagrams in your Blazor applications. Apart from these features, the Diagram has much more to offer, such as the ability to export diagrams into various image formats and bind data from different data sources. These can be used to design a real-time application.
For existing customers, the new version is available for download from the License and Downloads page. If you are not yet a customer, you can try our 30-day free trial to check out these new features.
If you have any questions about our applications, please let us know in the comments below. You can also contact us through our support forum, Direct-Trac, or feedback portal. We are happy to assist you!


 No spam, just valuable updates.