- Home
- Forum
- Xamarin.Forms
- How can i make customization Doughtnut chart slice as i want color
How can i make customization Doughtnut chart slice as i want color
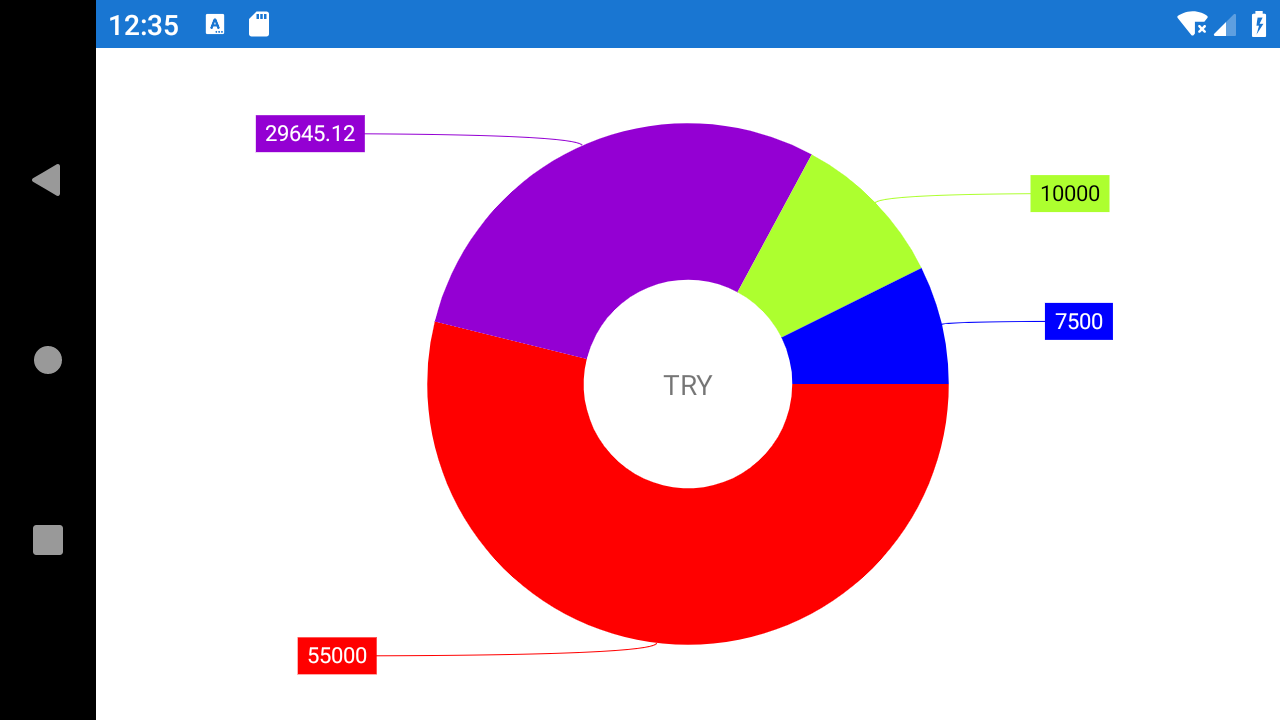
I want to change colors of the slices as I want as follows. How can
i add another property for color in ChartDataModel and how can i make
binding. Thank u

SIGN IN To post a reply.
3 Replies
RA
Rachel A
Syncfusion Team
July 15, 2019 07:29 AM UTC
Hi Mahmut,
Greetings from Syncfusion.
We can achieve this requirement by setting custom palette to series with the required colors. Also, have prepared a sample based on the requirement and it can download from the below link.
Sample – https://www.syncfusion.com/downloads/support/forum/145891/ze/145891-ChartSample-500870195.zip
Please find the code snippet below to achieve the same.
[XAML]:
|
<chart:SfChart.Series>
<chart:DoughnutSeries ItemsSource="{Binding Data}" XBindingPath="XValue" YBindingPath="YValue" >
<chart:DoughnutSeries.ColorModel>
<chart:ChartColorModel Palette="Custom" CustomBrushes="{Binding Colors}" />
</chart:DoughnutSeries.ColorModel>
</chart:DoughnutSeries>
</chart:SfChart.Series> |
[C#]:
|
public class ViewModel
{
public ChartColorCollection Colors { get; set; }
public ViewModel()
{
Colors = new ChartColorCollection();
Colors.Add(Color.Red);
Colors.Add(Color.DarkViolet);
Colors.Add(Color.GreenYellow);
Colors.Add(Color.Blue);
}
} |
Output:
Please refer below user documentation to know more details about custom palette.
Please let us know if you have any queries.
Regards,
Rachel.
I have a simular question about changing the color of the chart slices. lets say i have the following class:
List<Car> Cars
{
new Car { Category = "BMW", Amount = 2, Color = Green},
new Car { Category = "Audi", Amount = 4, Color = Blue },
new Car { Category = "Mercedes", Amount = 1, Color = Yellow },
}
Where Category is the xBindingPath and Amount is the yBindingPath. How can i bind the Color parameter to the the slices of the chart?
YP
Yuvaraj Palanisamy
Syncfusion Team
August 2, 2021 09:02 AM UTC
Hi Marlon,
We have analyzed your query and you can bind custom color collection to CustomBrushes property of ChartColorModel and we didn’t directly bind Color to each segment as like XBindingPath and YBindingPath. Please find the code example below.
CodeSnippet: [MainPage.xaml]
|
<chart:SfChart.Series>
<chart:DoughnutSeries ItemsSource="{Binding Cars}"
XBindingPath="Category"
YBindingPath="Amount"
DataMarkerPosition="OutsideExtended">
<chart:DoughnutSeries.DataMarker>
<chart:ChartDataMarker/>
</chart:DoughnutSeries.DataMarker>
<chart:DoughnutSeries.ColorModel>
<chart:ChartColorModel Palette="Custom"
CustomBrushes="{Binding Colors}" />
</chart:DoughnutSeries.ColorModel>
</chart:DoughnutSeries>
</chart:SfChart.Series> |
ViewModel.cs
|
public ViewModel()
{
Cars = new ObservableCollection<Car>()
{
new Car { Category = "BMW", Amount = 2, Color = Color.Green },
new Car { Category = "Audi", Amount = 4, Color = Color.Blue },
new Car { Category = "Mercedes", Amount = 1, Color = Color.Yellow },
};
Colors = new ChartColorCollection();
foreach(var item in Cars)
{
Colors.Add(item.Color);
}
} |
Also, we have attached the sample for your reference, please find the sample from the below link.
Output:

For more detail, please refer the below link.
Regards,
Yuvaraj.
SIGN IN To post a reply.
- 3 Replies
- 4 Participants
-
MN Mahmut Nedim
- Jul 12, 2019 07:18 AM UTC
- Aug 2, 2021 09:02 AM UTC
