ej-Chart does not load data async
I'm trying to load data asynchronously to the chart.

After loading data from a web service, I'm setting the datasource and calling the redraw (as I saw on fórum), but the chart does not load the data.
I keep the sample load on request completed to sure that I does not doing anything wrong., but does not load, in synchronous mode loads perfectly.
Here is my code:
onchartload(sender) {
console.log("onchartload(sender)...");
this.mvtService = new MvtService(this.nav, this.http);
this.mvtService.getCurrentQuery((query) => {
this.mvtService.runQuery(query.Codigo, (ret) => {
console.log("runQuery completado...");
this.enableTabScroll = true;
//Here the sample
this.CountriesList = [
{ xName: 'USA', yName: 50, yName1: 70, yName2: 45 },
{ xName: 'China', yName: 40, yName1: 60, yName2: 55 },
{ xName: 'Japan', yName: 70, yName1: 60, yName2: 50 }
];
this.commonSeriesOptions = { type: 'column', enableAnimation: true, tooltip: { visible: true, format: '#point.x# : #point.y#' } };
this.title = { text: 'Olympic Medals' };
this.legend = { visible: true, position: 'top' };
this.primaryXAxis = { axisLine: { visible: true } };
this.primaryYAxis = { range: { min: 0, max: 80, interval: 20 } };
//load
if (!ej.util.isNullOrUndefined(window.orientation) && sender) { //to modify chart properties for mobile view
var model = sender.model,
seriesLength = model.series.length;
model.title.enableTrim = true;
model.elementSpacing = 5;
model.legend.visible = false;
model.size.height = null;
model.size.width = null;
for (var i = 0; i < seriesLength; i++) {
if (!model.series[i].marker)
model.series[i].marker = {};
if (!model.series[i].marker.size)
model.series[i].marker.size = {};
model.series[i].marker.size.width = 6;
model.series[i].marker.size.height = 6;
}
model.primaryXAxis.labelIntersectAction = "rotate45";
if (model.primaryXAxis.title)
model.primaryXAxis.title.text = "";
model.primaryXAxis.edgeLabelPlacement = "hide";
model.primaryYAxis.labelIntersectAction = "rotate45";
if (model.primaryYAxis.title)
model.primaryYAxis.title.text = "";
model.primaryYAxis.edgeLabelPlacement = "hide";
if (model.axes) {
for (var j = 0; j < model.axes.length; j++) {
model.axes[j].labelIntersectAction = "rotate45";
if (model.axes[j].title)
model.axes[j].title.text = "";
model.axes[j].edgeLabelPlacement = "hide";
}
}
model.redraw();
console.log("model.redraw();")
}
});
});
}
SIGN IN To post a reply.
1 Reply
DD
Dharanidharan Dharmasivam
Syncfusion Team
January 2, 2017 02:41 PM UTC
Hi Gabriel,
Thanks for using Syncfusion product.
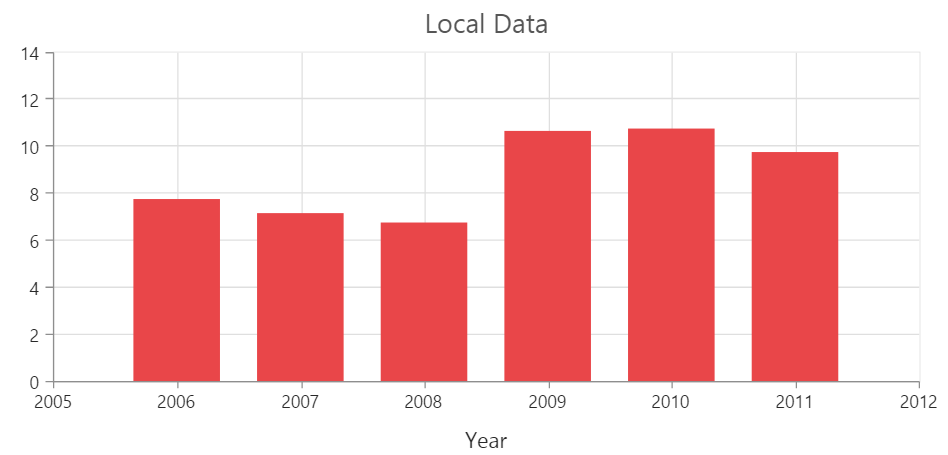
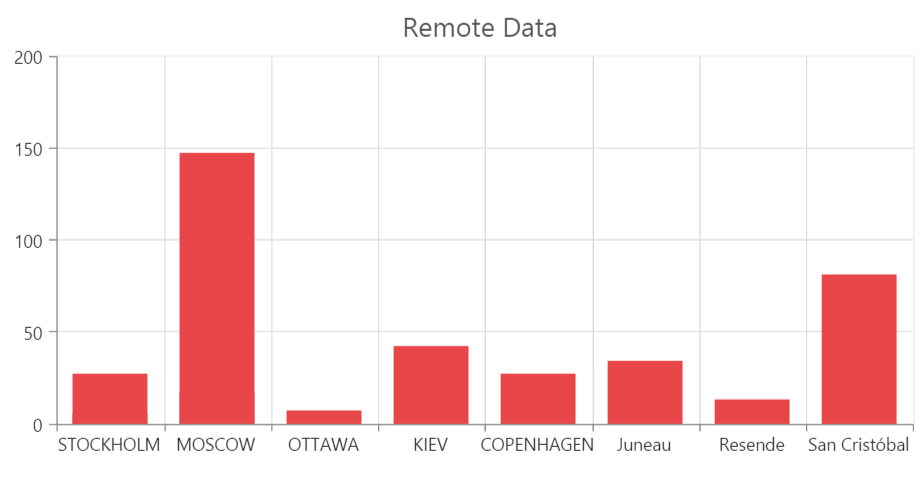
We have analyzed your query from the provided code snippet, it seems that you have binded remote data and local data in the sample. So we have prepared sample in which we have binded first chart with local data and the second we have binded remote data. If you use load method of chart control, then you no need to call redraw method after binding data to dataSource. Kindly find the code snippet below.
| Ionic : <div id="chart1" ej-chart e-load="chartLoad" > <e-series> <e-series e-xName="xName" e-yName="yName"></e-series> </e-series> </div> <div id="chart2" ej-chart> <e-series> <e-series e-dataSource="dataManger" e-xName="ShipCity" e-yName="Freight" e-query="query"></e-series> </e-series> </div> //Remote Data $scope.dataManger = new ej.DataManager({ url: "https://mvc.syncfusion.com/Services/Northwnd.svc/" }); $scope.query = ej.Query().from("Orders").take(10); //Local Data $scope.chartLoad = function (sender) { var chartData = [{ xName: 2006, yName: 7.8}, { xName: 2007, yName: 7.2 }, { xName: 2008, yName: 6.8 }, {xName: 2009, yName: 10.7 }, { xName: 2010, yName: 10.8 }, { xName: 2011, yName: 9.8}]; //Binding local data to dataSource sender.model.series[0].dataSource = chartData; } |
Screenshot for local data:
Screenshot for remote data:
For your reference we have attached the sample. Kindly find the sample from below location.
If you still face any concern, kindly revert us your sample with replication steps, so that we can able to provide the solution sooner.
Dharani.
SIGN IN To post a reply.
- 1 Reply
- 2 Participants
-
GT Gabriel Trevisani da Silva
- Dec 29, 2016 12:21 PM UTC
- Jan 2, 2017 02:41 PM UTC
