
The Flutter Charts widget is a well-crafted control for visualizing data. It contains a rich gallery of over 30 charts and graphs, ranging from line to financial, that cater to all charting scenarios. In this blog post, I’ll quickly introduce the new features included in the Flutter Charts widget for the 2021 Volume 2 release.
Let’s see them!
Millisecond interval
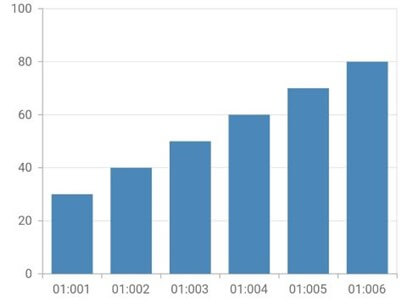
DateTimeAxis and DateTimeCategoryAxis now support millisecond intervals. With this support, you can render the data points of a chart with millisecond differences. To achieve this, set the intervalType property of the axis as DateTimeIntervalType.milliseconds.
The following example shows how to render the date-time category axis with millisecond intervals in Flutter Charts.
[Dart]
// Chart data source with millisecond date-time x values.
final List<LiveData> chartData = <LiveData>[
  LiveData(x: DateTime(2012, 10, 15, 00, 00, 01, 001), y: 30),
  LiveData(x: DateTime(2012, 10, 15, 00, 00, 01, 002), y: 40),
  LiveData(x: DateTime(2012, 10, 15, 00, 00, 01, 003), y: 50),
  //...
];

@override
Widget build(BuildContext context) {
  return Container(
    child: SfCartesianChart(
      primaryXAxis: DateTimeCategoryAxis(
        // DateTime axis interval type is set as milliseconds.
        intervalType: DateTimeIntervalType.milliseconds,
        // Applied seconds:milliseconds format.
        dateFormat: DateFormat('ss:SSS')
      ),
      series: <ChartSeries<LiveData, DateTime>>[
        ColumnSeries<LiveData, DateTime>(
        dataSource: chartData,
        xValueMapper: (LiveData sales, _) => sales.x,
        yValueMapper: (LiveData sales, _) => sales.y),
      ],
    )
  );
}
Refer to the following screenshot.
Note: For more information, refer to the axis interval type demo and documentation.
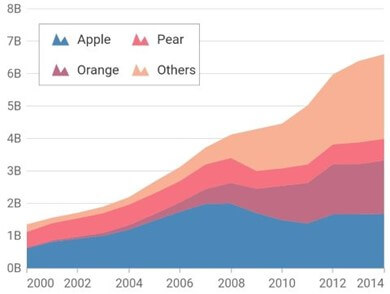
Floating legend
You can now move the legend and place it anywhere on the top of the Flutter Chart widget. Also, the legend will not take a dedicated position. You can draw it even on top of the chart’s plot area. To achieve this, specify the value for the offset property available in the legend. Now, the legend will be moved from its original position.
For example, if the position property of the legend is set as LegendPosition.top, then the legend will be placed on the top, but in the position specified by the offset property relative to the original top position.
This useful feature applies to these four chart widgets:
The following code example shows how to place a legend in a custom position.
[Dart]
SfCartesianChart(
  primaryXAxis: DateTimeAxis(),
  legend: Legend(
    isVisible: true,
    // Legend will be placed at the specified offset position.
    offset: Offset(20, 40)
  ),
  //...
)
Refer to the following screenshot.
Note: For more information, refer to the legend positioning demo and documentation.
Controlling deselection
Previously, when you tapped on a selected data point, it would be deselected. With the 2021 Volume 2 release, you can now decide whether to deselect the data point or let it remain selected by tapping it in the Flutter Charts widget. You can achieve this by setting values to the toggleSelection property in SelectionBehavior.
If the value in the toggleSelection property is true, you can deselect the selected points. If the value is false, then you can’t deselect the selected data points. This property defaults to true. This feature works even while calling public methods, in various selection modes, with multi-selection and on dynamic changes.
This feature is applicable for all four chart widgets:
Refer to the following code example.
[Dart]
late SelectionBehavior _selectionBehavior;

@override
void initState() {
  _selectionBehavior = SelectionBehavior(enable: true, toggleSelection: false);
  super.initState();
}

@override
Widget build(BuildContext context) {
  return Scaffold(
    body: Center(
      child: SfCircularChart(
        series: <CircularSeries<AgeDistributionData, String>>[
          PieSeries<AgeDistributionData, String>(
            dataSource: chartData,
            xValueMapper: (AgeDistributionData data, _) => data.x,
            yValueMapper: (AgeDistributionData data, _) => data.y,
            selectionBehavior: _selectionBehavior
          )
        ]
      ),
    )
  )
}
Refer to the following .gif image.
Note: For more information, refer to the selection modes demo and documentation.
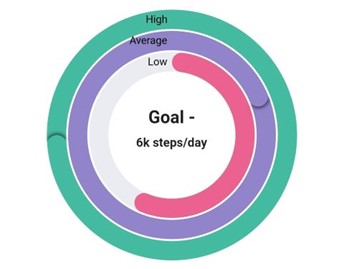
Overfilled radial bar chart
Now, you can indicate a value that is beyond the maximum value by overfilling the radial bar chart. For example, if you set the maximumValue property of the RadialBarSeries to 100, but the radial bar data point value is 150. Then, it will render the chart by overfilling the current data point. You don’t need any additional property to achieve this. This works by default.
Refer to the following code example.
[Dart]
final List<StepsCountData> chartData = <StepsCountData>[
  StepsCountData('Low', 3500),
  StepsCountData('Average', 7200),
  StepsCountData('High', 10500),
];

SfCircularChart(
  series: <CircularSeries>[
    RadialBarSeries<StepsCountData, String>(
      // Setting the maximum value as 6000.
      maximumValue: 6000,
      dataSource: chartData,
      xValueMapper: (StepsCountData data, _) => data.x,
      yValueMapper: (StepsCountData data, _) => data.y
    )
  ]
)
Refer to the following screenshot.
Note: For more information, refer to the overfilled radial bar demo and documentation.
Callbacks for data point interactions
There may be several scenarios in an app that require performing certain actions while interacting with its data points. For this, we added three new callbacks in the Flutter charts in the 2021 Volume 2 release:
These callbacks are called when tapping, double-tapping, and long-pressing on the data points in the chart, respectively.
With these, you can get the point index, viewport point index, and series index values of the interacted data point. Also, you can get the list of data points in that series in all three callbacks.
This feature is applicable for all four chart widgets:
The following example shows how to define and get values from the onPointLongPress callback. In the same way, you can use the OnPointTap and onPointDoubleTap callbacks.
[Dart]
SfCartesianChart(
  series: <ChartSeries<SalesData, num>>[
    ColumnSeries(
      dataSource: chartData,
      //Retrieving the long-pressed data point values.
      onPointLongPress: (ChartPointDetails details) {
        print(details.pointIndex);
        print(details.seriesIndex);
      }
    )
  ]
)
Note: For more information, refer to the data point events demo and documentation.
Retrieving all the calculated indicator values
In some scenarios, we may require internally calculated technical indicator values at the application level for further processing. With the 2021 Volume 2 release, the Flutter Charts widget now allows you to get internally calculated indicator values using the onRenderDetailsUpdate callback event in TechnicalIndicators. This callback will be called while rendering an indicator.
Using this callback event, you can get the indicator name and calculated data point values. Also, you can change the values of line color, width, and a dash array using this callback event.
The following code example shows how to define the onRenderDetailsUpdate indicator and how to get and set values in it.
[Dart]
SfCartesianChart(
  indicators: <TechnicalIndicators<ChartData, DateTime>>[
    SmaIndicator<ChartData, DateTime>(
      onRenderDetailsUpdate: (IndicatorRenderParams params) {
        // Modifying the color, width and dash array of the signal line.
        return ChartIndicator(Colors.cyan, 3.0, <double>[5,5]);
      }
    )
  ]
)
Note: For more information, refer to the indicator callback documentation.
Breaking Changes
Now, let’s see about the breaking changes in the Flutter Charts widget in the 2021 Volume 2 release.
onPointTapped callback is deprecated
The onPointTapped callback in the SfCartesianChart has been deprecated. Instead, use the onPointTap callback event available in the CartesianSeries class to get the tapped data point details.
This new callback feature is available for all four chart widgets:
The following code example shows how to use the onPointTap callback and retrieve details with it.
[Dart]
SfCartesianChart(
  series: <ChartSeries<SalesData, num>>[
    ColumnSeries(
      dataSource: chartData,
      //Retrieving the tapped data point values.
      onPointTap: (ChartPointDetails details) {
        print(details.pointIndex);
        print(details.seriesIndex);
      }
    )
  ]
)
onIndicatorRender callback is deprecated
The onIndicatorRender callback has been deprecated in our Flutter Charts. Instead, use the onRenderDetailsUpdate callback in the TechnicalIndicators class to get the indicator details. The Flutter Charts will call this callback while rendering an indicator.
Conclusion
I hope you now have a clear idea about the new, useful features in the Syncfusion Flutter Charts widget for the 2021 Volume 2 release. For more details about the bug fixes and other enhancements, check out our release notes and What’s New pages. Try out these new features and leave your feedback in the comments section!
Also, browse through our documentation to learn more about our Flutter widgets. You can also see Syncfusion’s Flutter app with many examples in our GitHub repository. Don’t miss our demo app in Google Play, the App Store, the Windows Store, the App Center, Snapcraft, and on our website.
If you aren’t a customer yet, you can try our 30-day free trial to check out these features.
You can also contact us through our support forum, feedback portal, or Direct-Trac support system. We are always happy to assist you!


 No spam, just valuable updates.