

We are happy to announce updates to our popular Xamarin charts control with the release of Essential Studio® 2019, Volume 2. Updates for the graph component include WPF support on Xamarin platforms and other usability-related features based on customer feedback, such as:
- Chart support for WPF in Xamarin.Forms (preview)
- Waterfall series
- Appearance customization for individual axis elements
Chart support for WPF in Xamarin.Forms (Preview)
Our Xamarin.Forms chart now has preview support for Windows Presentation Foundation (WPF) with the same features as other platforms. Let’s look at how it’s configured.
Create a new WPF project and add the Xamarin libraries, as explained in Microsoft’s user guide, to include the WPF platform as a target in your existing Xamarin project. Next, install the Syncfusion.Xamarin.SfChart.WPF NuGet package and initialize SfChartRenderer, as shown in the following code found in MainWindow.xaml.cs.
C#
public partial class MainWindow : FormsApplicationPage
{
     public MainWindow()
     {
            InitializeComponent();

            Forms.Init();

            Syncfusion.SfChart.XForms.WPF.SfChartRenderer.Init();

            LoadApplication(new App());
     }
}
That’s it! Now you can install beautiful chart control in your app in a version prior to Windows 10.
Waterfall Series
A waterfall series allows users to visualize the cumulative effect of a set of positive and negative values by using connected rectangles to represent data. The following code shows how to configure a waterfall series in a chart.
XAML
<chart:WaterfallSeries
ItemsSource="{Binding RevenueDetails}" XBindingPath="Name"
YBindingPath="Value" SummaryBindingPath="IsSummary"
NegativeSegmentColor="#F14C72" SummarySegmentColor="#8C8C8C"
Color="#50C380" />
C#
WaterfallSeries waterfallSeries = new WaterfallSeries();
waterfallSeries.ItemsSource = viewModel.RevenueDetails;
waterfallSeries.XBindingPath = "Name";
waterfallSeries.YBindingPath = "Value";
waterfallSeries.SummaryBindingPath = "IsSummary";
waterfallSeries.Color = Color.FromHex("#50C380");
waterfallSeries.SummarySegmentColor = Color.FromHex("#8C8C8C");
waterfallSeries.NegativeSegmentColor = Color.FromHex("#F14C72");
chart.Series.Add(waterfallSeries);
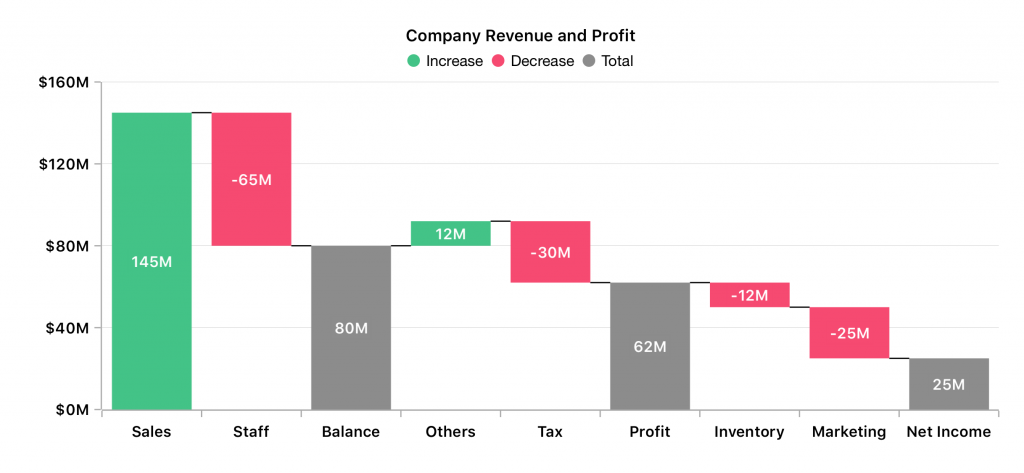
Waterfall Series
Customizing individual axis elements
Charts are good for displaying metrics and comparisons. This example shows how to change the appearance of an individual axis element based on threshold value so that users can easily understand whether the charted values are above or below the specified threshold.
XAML
<chart:NumericalAxis "Minimum="15" Maximum="27">
    <chart:NumericalAxis.RangeStyles>
        <chart:ChartAxisRangeStyleCollection>
            <chart:ChartAxisRangeStyle Start="15" End="21">
                <chart:ChartAxisRangeStyle.MajorGridLineStyle>
                    <chart:ChartLineStyle StrokeColor="#096EBF" StrokeWidth="3"/>
                </chart:ChartAxisRangeStyle.MajorGridLineStyle>
                <chart:ChartAxisRangeStyle.LabelStyle>
                    <chart:ChartAxisLabelStyle TextColor="#096EBF" FontAttributes="Bold"/>
                </chart:ChartAxisRangeStyle.LabelStyle>
            </chart:ChartAxisRangeStyle>
            <chart:ChartAxisRangeStyle Start="21" End="27">
                <chart:ChartAxisRangeStyle.MajorGridLineStyle>
                    <chart:ChartLineStyle StrokeColor="#0D9955" StrokeWidth="3"/>
                </chart:ChartAxisRangeStyle.MajorGridLineStyle>
                <chart:ChartAxisRangeStyle.LabelStyle>
                    <chart:ChartAxisLabelStyle TextColor="#0D9955" FontAttributes="Bold"/>
                </chart:ChartAxisRangeStyle.LabelStyle>
            </chart:ChartAxisRangeStyle>
        </chart:ChartAxisRangeStyleCollection>
    </chart:NumericalAxis.RangeStyles>
</chart:NumericalAxis>
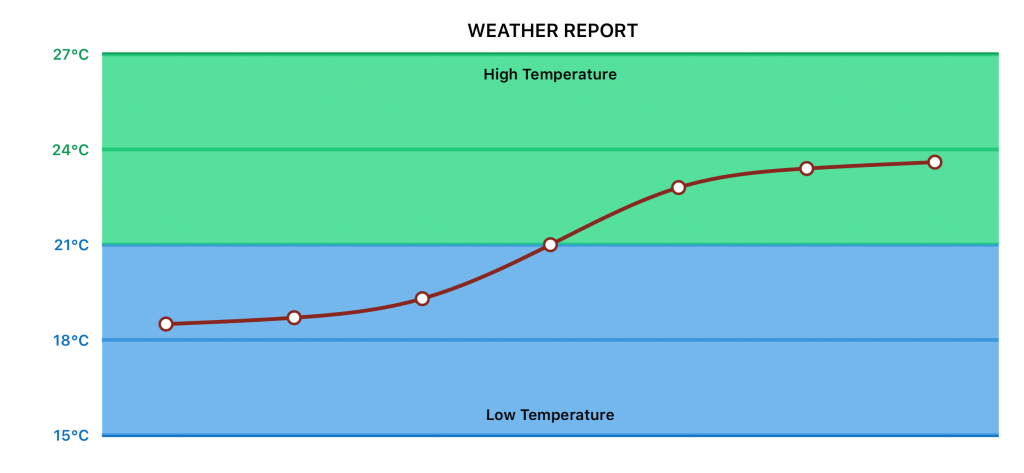
Customized Chart
Conclusion
We included a few more features in Volume 2 other than those mentioned:
- Auto-sizing support for accumulation series.
- Labels for all data points on top of a chart along the vertical trackball line.
- Chart zooming based on pinch gesture direction.
Looking at our release notes, you can learn more about everything that was introduced in Essential Studio® 2019, Volume 2. To get an even clearer understanding of what’s included in Volume 2, download Essential Studio®‘s recent version or try any platform suite as a free 30-day trial.
Play with our Charts control in Xamarin.Forms with the samples available in this GitHub location. Also, explore our samples available on Google Play and the Microsoft Store. Learn about the controls’ advanced features in our documentation.
Didn’t find the feature you expect? Please post a comment in this blog, to know its status.


 No spam, just valuable updates.