Syncfusion is excited to share that the new report designer is now available for web applications (Essential JS 1) from 2018 Volume 2 onward. The report designer provides a modern, web-based, and user-friendly environment for creating and customizing RDL 2008/2008 R2 specification standard reports inside web browsers interactively.
A report collects data from various data sources and presents it to end-users in a way that is understandable and ready for easy, efficient, and accurate analysis, as well as faster decisions. Our modern and easy-to-use design capabilities let the users generate precisely formatted, beautiful reports with important features such as tables, pivot tables, and visualization elements. In this article, let’s discuss the functionalities available for interacting with reports.
WYSIWYG designer
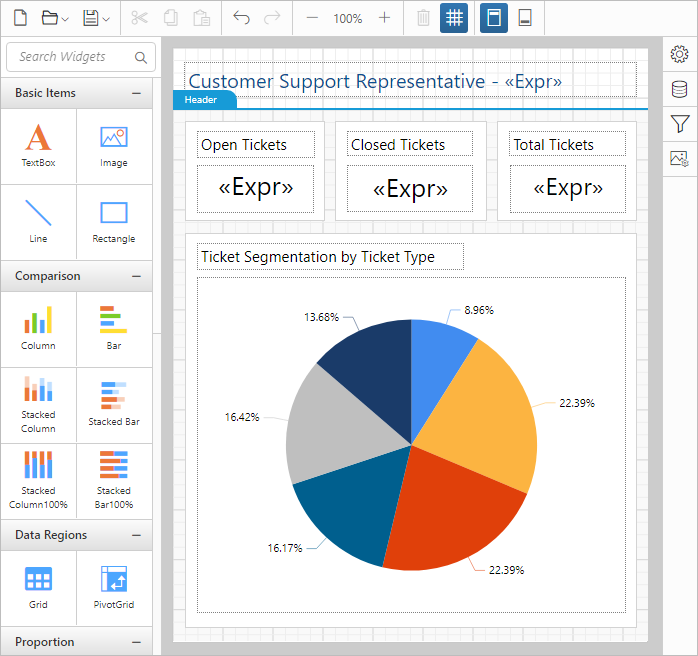
A WYSIWYG canvas in report designer allows perfect positioning, sizing, and aligning of report items. The design area has improved the flexibility of report designing with the help of gridlines and snap-to-grid to simplify positioning and aligning report elements.
Report design area with header and grid-lines enabled
Connect to your data
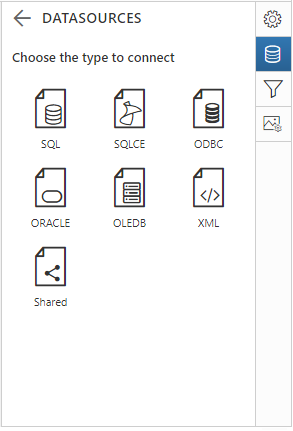
Explore your data from the server. With connections to major data providers (SQL, Oracle, OLEDB, ODBC, and XML), report designer lets you create reports with a wide range of data sources.
Supported data source types
Build data query with ease
Dataset query preparation can take most of your time. But with report designer SQL query builder, data query generation can be done with a few clicks. Reclaim time in your day.
Creating SQL queries with visual query builder
Drag-and-drop report creation
The report canvas allows drag-and-drop item rearrangement and the use of gridlines and snap-to-grid to create and edit reports faster than ever.
Charts, pivot, subreports, and more
Report designer comes with a set of data visualization, data region, and reporting basic items to build reports efficiently:
- Basic Items—Text box, image, line, and rectangle.
- Data Region Items—Table and pivot.
- Data Visualization—20+ chart types.
- Subreport
Report styling and data assigning
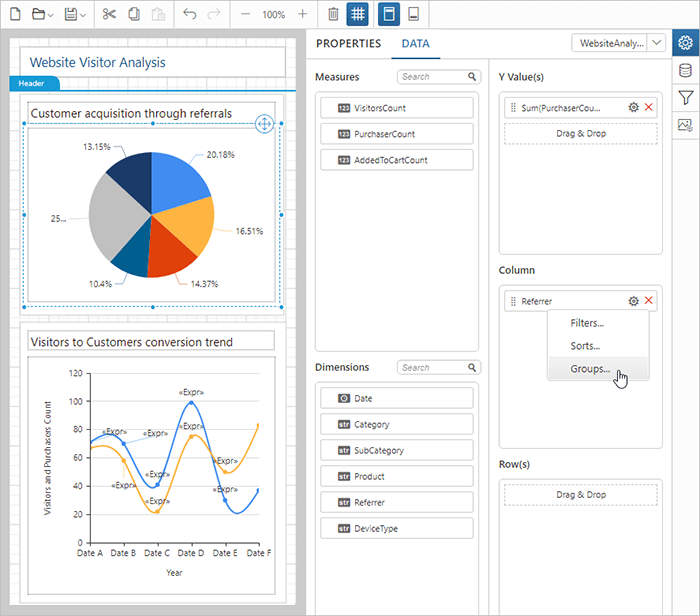
The properties and data pane significantly simplify report setup and styling. All report items come with a property pane to customize appearances and edit item properties. The data visualization items have a data pane to set data values, groups, sorting, and filters.
Adding category group and values for chart
ReportParameters
Users can interactively input values to customize the contents or appearance of a report using ReportParameters. It allows users to filter, sort, and group report data interactively at run time, and modify data presentation. It also can be used within property expressions.
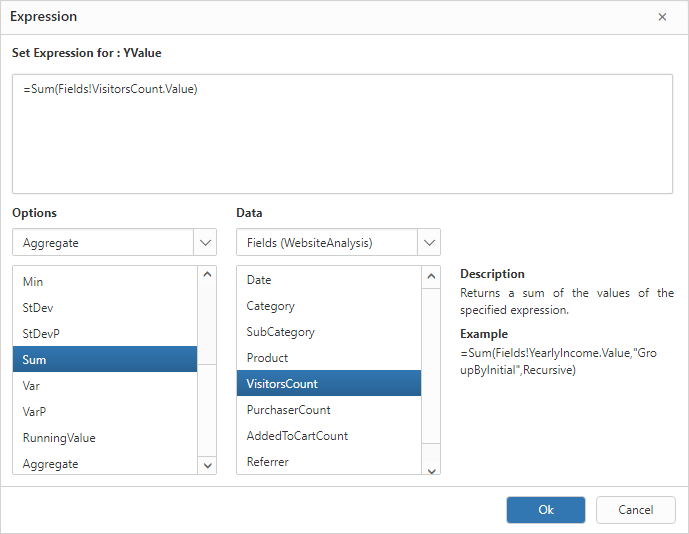
Expressions
Expression builder makes expression creation a lot easier, and it comes with a set of RDL standard, predefined, built-in fields, collections, functions, and much more, to write Microsoft Visual Basic expressions for report item properties. The expressions are used throughout the report definition to specify or calculate values for parameters, queries, filters, report item properties, and all dynamic content and images.
Creating sum aggregate expression for chart Y axis value
Create once and share with everyone, anywhere
Create reports and publish them to the report server, either on-premises or embed reports into existing applications or websites for viewers to consume on the go.
Export reports for sharing
Reports can be exported to common formats like PDF, Word, Excel, PPT, and HTML for further data analysis and report sharing.
The report designer allows users to view and interact with their reports in any modern web browser with a more optimized user interface. Syncfusion invites you to try out report designer in the 2018 Volume 2 release. You can find the 2018 Volume 2 Essential JS 1 install download link
here. Leave us your valuable feedback or questions in the comments section below.
If you like this blog post, we think you’ll also like the following free e-books:


 No spam, just valuable updates.