

TL;DR: Modern React stock chart libraries have evolved around performance, customization, and real-time data handling. This article explores how today’s leading React stock chart options approach visualization, interaction, indicators, and scale, and where they differ in practical usage.
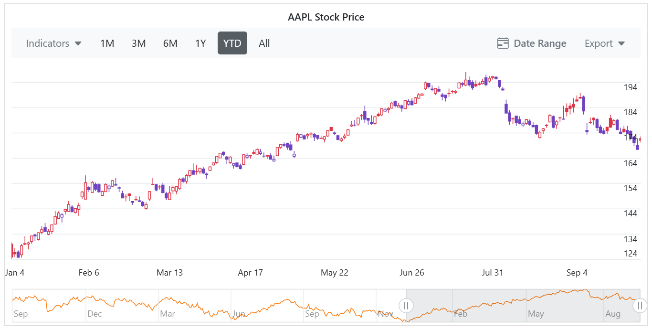
Stock charts sit at the core of most financial applications. They carry far more responsibility than simply plotting prices; they shape how users interpret volatility, identify patterns, and make time-sensitive decisions.
In React-based trading platforms, analytics tools, and portfolio dashboards, stock chart libraries serve as the visual translation layer between raw market data and user insights. That translation needs to stay accurate under pressure: live updates, large datasets, multiple timeframes, and user interaction happening simultaneously.
Over the last few years, stock chart libraries have shifted focus from basic rendering to responsiveness, extensibility, and sustained performance under real-time workloads.

Key advancements in modern React Stock Chart Libraries
The advancements outlined below highlight why selecting the right stock chart library now matters more than ever.
- Improved performance: Modern stock chart libraries now support efficient real-time data streaming, ensuring smooth updates without performance lag, even when tracking high-frequency stock movements.
- Mobile-first design: With the rise of mobile trading apps, these libraries prioritize touch-friendly interactions, responsive layouts, and adaptive designs for a seamless experience across all devices.
- Advanced customization: Developers can fine-tune every chart aspect, from colors, fonts, and themes to grid lines and annotations, resulting in better branding and enhanced user experience.
- Expanded chart types and indicators: Modern libraries offer a wide range of stock chart types, such as candlestick, OHLC, Heikin-Ashi, and Renko, along with built-in technical indicators like Bollinger Bands, MACD, RSI, and SMA.
This blog explores the top five React Stock Chart libraries, their features, and how they help developers create professional stock market visualizations.
Top 5 React Stock Chart Libraries
Financial applications rely on stock chart libraries to visualize price movements, indicators, and historical trends. The following React stock chart libraries are commonly used in production applications.
1. Highcharts React Stock Chart
Highcharts React Stock Charts focuses on structured financial charting with a mature API and predictable behavior under real-time updates. It’s often used in applications where stability and consistency matter more than visual experimentation.
To integrate Highcharts React Stock Charts, run the following commands:
npm install highcharts –save
npm install highcharts-react-official
The key features include:
- Stock-chart collection: Supports OHLC, candlestick, and range series for detailed stock analysis.
- Interactive range selector: Users can filter data by different timeframes (e.g., 1 month, 6 months, 1 year).
- Real-time data streaming: Supports WebSocket integration for live market feeds.
- Technical indicators: Includes Bollinger Bands, SMA, MACD, and RSI.
- Cross-platform support: Works on both desktop and mobile devices.
2. amCharts 5 Stock Chart
The amCharts 5 provides interactive stock charts. It is ideal for apps requiring smooth animations and highly customizable visualizations. It is often used when visual presentation and animation quality are prioritized alongside standard stock chart functionality.
To integrate amCharts 5 into your project, run the following command:
npm install @amcharts/amcharts4Here are the key features:
- Animated stock charts: Supports candlestick, OHLC, step line, and Renko charts.
- Pre-built technical indicators: Includes SMA, EMA, MACD, and more.
- Customization: Allows gradient fills, shadows, and stylish themes.
- Mobile-first design: Works on touch devices.
3. AnyChart React Stock Chart
AnyChart is a stock charting solution that supports large datasets efficiently. It is suitable for applications that handle large datasets and offers a wide range of built-in technical indicators.
To integrate the AnyChart React Stock Chart into your project, run the following command:
npm install anychart-reactThe key features include:
- Technical indicators: Includes over 20 options such as Fibonacci retracement, SMA, and Bollinger Bands and more.
- Data grouping and range selection: Makes it easy to navigate through different timeframes.
- Export capabilities: Save charts like PNG, PDF, Excel, or SVG.
- Customization: Modify colors, labels, and tooltips with ease.
4. CanvasJS React Stock Chart
The CanvasJS is a stock charting library designed for efficient rendering and smooth animations. CanvasJS is typically chosen for performance-focused applications that require smooth rendering with a relatively simple API.
To install the CanvasJS React Stock Chart, use the following npm command:
npm install @canvasjs/react-chartsHere are the key features:
- Real-time stock data visualization: Supports dynamic updates for live trading apps.
- Multiple stock chart types: Includes candlestick, OHLC, and line charts.
- Zooming and panning: Allows users to explore stock price movements.
- Optimized for performance: Ideal for apps that need smooth interaction.
- Free version available: Suitable for personal projects and educational use.
5. Syncfusion React Stock Chart
Syncfusion React Stock Chart is a financial charting library for building interactive, data-driven stock market applications in React. It supports key stock chart types such as Candlestick, OHLC, and HiLo, enabling clear visualization of price movements and market trends over time.
To install the Syncfusion React Charts, use the following npm command:
npm install @syncfusion/ej2-react-chartsThe key features include:
- Multiple financial chart types, including candlestick, OHLC, spline area, line, Hilo, and multi-series stock charts.
- Built‑in technical indicators such as SMA, EMA, MACD, RSI, Bollinger Bands, ATR, momentum, TMA, and stochastic indicators.
- Interactive tooling with zooming, panning, crosshair, trackball, tooltips, period selectors, and navigators.
- Optimized rendering for large datasets and continuous updates.
- Real-time data integration is commonly used with WebSocket-based feeds.
- Responsive and touch-enabled design.
- Export and print support for PNG, JPG, PDF, SVG, CSV, and Excel formats.
- Accessibility alignment, including ARIA roles and WCAG-focused keyboard and screen‑reader support.
Ready to learn more? Explore our official documentation for step-by-step guidance.
Frequently Asked Questions
Which React stock chart libraries handle real-time data well?
Most modern libraries support live updates, but their performance characteristics differ depending on how frequently data changes and how large the dataset grows.
Do these libraries support mobile interaction?
Yes. Touch gestures like zooming and panning are now standard across most actively maintained stock chart libraries.
Are technical indicators built in or custom?
All libraries listed here include common indicators such as SMA and RSI. The depth and flexibility of indicator support vary by library.
Can charts be exported for reporting?
Several libraries support exporting to formats like PNG, PDF, SVG, or Excel, though the scope and configuration options differ.
What should influence library selection most?
Data scale, real-time behavior, customization tolerance, accessibility needs, and long-term maintenance costs usually matter more than feature checklists.
Conclusion
Thank you for exploring this blog! React stock chart libraries have matured well beyond basic visualization. Performance under live updates, mobile interaction quality, indicator depth, and long‑term extensibility now define real‑world viability.
Rather than looking for a universally “best” option, teams typically narrow their choices based on data volume, interactivity expectations, customization depth, and maintenance overhead. Understanding how each library approaches those trade‑offs makes selection far more predictable, and far less costly down the line.
To unlock the full potential of stock market data visualization, carefully evaluate your project needs and choose the library that best meets your objectives.
If you have any questions or need assistance, feel free to contact us through our support forum, support portal, or feedback portal. We are always here to assist you!


 No spam, just valuable updates.