
TL;DR: Explore why project management is challenging, how Gantt charts simplify planning with visual timelines, and what to consider when choosing a modern JavaScript Gantt chart library, from lightweight tools to enterprise grade solutions.
Why project management is hard
“Plans are nothing; planning is everything.” — Dwight D. Eisenhower
Project management is challenging because it requires balancing people, timelines, priorities, and constant change. Even with clear goals, shifting requirements, tight deadlines, limited resources, and task dependencies can quickly derail progress. A small delay in one task often cascades across the entire project.
How Gantt Charts make planning easier
Spreadsheets and basic task lists work for simple plans, but they struggle with real‑world complexity. They make it difficult to see task relationships, track current progress, or spot risks early, often leading to missed deadlines and poor coordination.
Gantt Charts solve this by turning project plans into visual timelines. They display tasks, start and end dates, dependencies, milestones, and progress in one clear view, making it easy to understand what’s happening now and what’s coming next.
Modern JavaScript Gantt Chart libraries take this further with interactivity, real‑time updates, and seamless framework support for React, Angular, and Vue. Choosing the right library can make or break your project planning UI.
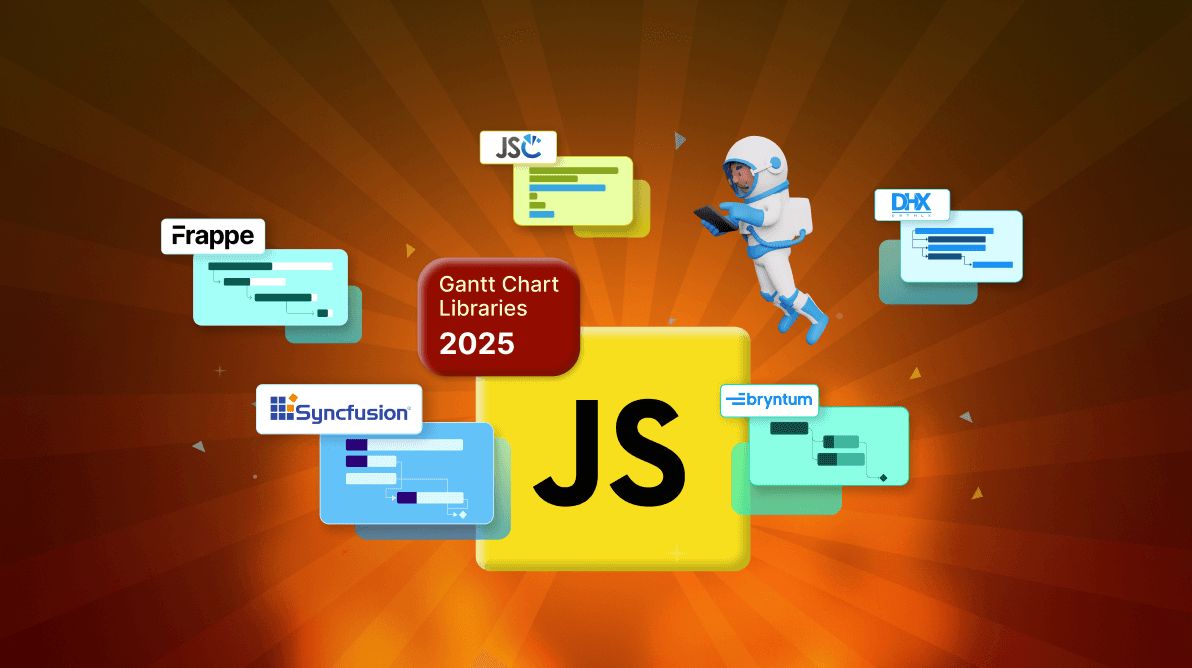
Let’s explore the top 5 JavaScript Gantt Chart libraries and see which ones stand out for building modern, interactive project planning experiences.

1. Syncfusion® Gantt Chart
The Syncfusion JavaScript Gantt Chart is a comprehensive solution for enterprises and developers seeking robust project management tools. Its strength lies in integrating with modern frameworks like Angular, React, and Vue, enabling seamless development.
It supports advanced scheduling features such as critical path analysis, resource management, accessibility compliance, and large dataset handling, which are typically required in enterprise-scale project management applications.
Syncfusion Gantt Chart has more than 23,000 weekly downloads and 440 GitHub Stars.
Key features
- Critical path analysis: Automatically identifies and visualizes tasks influencing the project deadline.
- Resource management: Efficiently manages team allocations and workloads.
- Virtual scrolling: Handles large datasets with seamless scrolling and rendering.
- Advanced export options: Allows exporting to Excel, PDF, and CSV for reporting and collaboration.
- Frozen columns for better focus: Lock important task details in place while scrolling through long timelines, so context is never lost.
- Clear milestone and event tracking: Display multiple milestones and key dates on the same timeline to track releases, reviews, and deadlines immediately.
- Smart task constraints and dependencies: Automatically keeps task dates aligned when dependencies change, ensuring project schedules remain accurate and realistic.
- Global-ready with localization support: Create Gantt charts that work in different languages and regions without extra setup.
- Accessibility built in by default: Supports keyboard navigation and screen readers, making project tracking usable for everyone.
- Works across modern frameworks: Use the same powerful Gantt chart in Angular, React, Vue, or plain JavaScript apps.
Installation
The following installation command is provided for evaluation purposes and is not intended as a complete implementation guide.
npm install @syncfusion/ej2-gantt
or
git clone https://github.com/SyncfusionExamples/ej2-quickstart-webpack
2. DHTMLX Gantt
DHTMLX Gantt supports scheduling and dynamic data handling. It allows users to manage dependencies, critical paths, and resources. It includes dynamic loading for working with large datasets. It supports various configuration options that let developers adjust the Gantt chart for different requirements. DHTMLX Gantt is used in apps that need customization and support for larger projects.
It is commonly used in medium to large projects where customization is important, though accessibility and framework-level abstractions may require additional effort.
DHTMLX has more than 16,000 weekly downloads and 1.7K GitHub Stars.
Key features
- Dynamic loading: Provides smooth performance for large datasets.
- Critical path and baselines: Tracks project milestones and dependencies.
- Customizable API: Offers deep customization for advanced project requirements.
- Export options: Export data to multiple formats, including PDF and Excel.
Installation
The following installation command is provided for evaluation purposes and is not intended as a complete implementation guide.
npm install dhtmlx-gantt

3. Bryntum Gantt
Bryntum Gantt includes features such as constraints, milestones, and custom time axes. The library provides integration with frameworks like Angular, React, and Vue.
Bryntum Gantt supports resource management and dependency tracking. It provides control over timelines and is used in projects that require detailed scheduling. It is often chosen for scheduling-heavy apps, but its commercial licensing and learning curve can be considerations for some teams.
Bryntum has more than 270 weekly downloads
Key features
- Scheduling constraints: Allows fine control over task dependencies.
- Resource management: Tracks resource allocation and load balancing.
- Customizable time axis: Provides precise control over time scales and visual layouts.
Installation
The following installation command is provided for evaluation purposes and is not intended as a complete implementation guide.
npm install @bryntum/gantt
4. JSCharting Gantt
JSCharting Gantt supports task, dependency and schedule tracking. It provides a way to manage tasks, dependencies and schedules without requiring complex configuration in many cases.
The library includes interactive elements. It has a relatively small footprint and is used for small to mid-sized projects. Its API supports adding custom styles and behaviors. JSCharting Gantt is used in apps that need project management functionality with an emphasis on ease of use. It is better suited for smaller apps where simplicity is preferred over advanced scheduling features.
JSCharting has more than 960 weekly downloads.
Key features
- Percent complete indicators: Displays progress as a value or filled portion on task bars.
- Custom taskbars: Customize task appearances.
- Interactivity: Enhances user engagement with dynamic features.
Installation
The following installation command is provided for evaluation purposes and is not intended as a complete implementation guide.
npm install jscharting
5. Frappe Gantt
Frappe Gantt is an open-source library built for simplicity and minimalism. It focuses on a clean, straightforward interface for small-scale projects and prototypes.
This library uses SVG-based rendering, which provides clear visuals while keeping the file size small. Its API is compact and easy to integrate. It lacks features such as resource management and critical path analysis. Frappe Gantt is used in basic project management apps where simplicity is preferred.
Its minimal feature set makes it unsuitable for complex resource planning or enterprise-scale project tracking.
Frappe Gantt has more than 42,000 weekly downloads and 5.3K GitHub Stars.
Key features
- SVG-based rendering: Produces clean, visually appealing charts.
- Localization & styling options: Supports language changes, date formats, and custom bar/ arrow styles.
- Open source: Completely free for commercial and non-commercial use.
Installation
The following installation command is provided for evaluation purposes and is not intended as a complete implementation guide.
npm install frappe-gantt
Choose the right Gantt Chart for smarter project management
| Criteria | Syncfusion Gantt Chart | DHTMLX Gantt | Bryntum Gantt | JSCharting Gantt | Frappe Gantt |
| Best suited for | Enterprise‑scale project management apps | Medium to large custom projects | Scheduling‑intensive applications | Small to mid‑sized projects | Simple projects and prototypes |
| Scalability & performance | Excellent (handles large datasets with virtual scrolling) | Good (dynamic loading support) | Good (optimized scheduling engine) | Moderate | Limited |
| Task dependencies | Advanced (automatic sync, constraints) | Advanced | Advanced | Basic | Basic |
| Critical path support | Yes | Yes | Yes | No | No |
| Resource management | Comprehensive | Available | Available | Limited | Not supported |
| Interactivity | High (editing, drag‑and‑drop, live updates) | High | High | Moderate | Basic |
| Framework support | Angular, React, Vue, Blazor, ASP.NET | JavaScript‑based with integrations | Angular, React, Vue | JavaScript | JavaScript |
| Accessibility & localization | Built in (WAI‑ARIA, keyboard nav, globalization) | Limited | Limited | Minimal | Minimal |
| Export options | Excel, PDF, CSV | PDF, Excel | Limited | Not emphasized | Not available |
| Ease of setup | Moderate | Moderate | Moderate to steep | Easy | Very easy |
| Licensing | Commercial | Commercial | Commercial | Commercial | Open source |
| Ideal use case | Feature‑rich, enterprise‑ready planning solutions | Highly customizable business apps | Advanced scheduling logic | Simple visual planning | Lightweight timelines |
Compared to lighter or more specialized libraries, Syncfusion JavaScript Gantt Chart covers a broader range of scheduling, accessibility, localization, and framework integration requirements within a single component.
Conclusion
Thanks for reading! In this blog, we’ve explored the top JavaScript Gantt Chart libraries, highlighting their features, installation steps, and use cases. They contribute to a more robust and feature-rich tool, empowering project managers with advanced functionalities for effective planning and execution. I hope this will help developers choose the right JavaScript Gantt Chart library for their project requirements and desired features. Try out these features and leave your feedback in the comments section below!
The Syncfusion Gantt Chart is available in our Blazor and Essential JS 2 platforms. We encourage you to check out the demos for them:
| JavaScript Gantt Chart | Angular Gantt Chart | React Gantt Chart | Blazor Gantt Chart |
| Vue Gantt Chart | ASP.NET MVC Gantt Chart | ASP.NET Core Gantt Chart |
The new version of Essential Studio is available for existing customers on the License and Downloads page. If you’re new, sign up for our 30-day free trial to explore our features.
Feel free to contact us through our support forum, support portal, or feedback portal. We’re always here to assist you!


 No spam, just valuable updates.