

We are happy to introduce the new Bullet Chart control for the Essential JS 2 suite. It comes with the following functionalities:
- Web accessibility
- Touch-friendly features
- Right-to-left rendering
- Lightweight UIs
Bullet charts are used to visually compare measures, like the commonly used bar chart. They display one or more measures and compare them with a target value. You can also display measures in a range of performance such as poor, satisfactory, and good.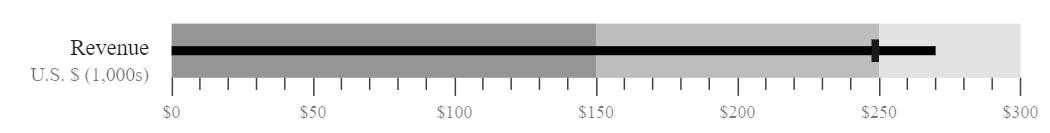
In this blog, we will provide a walk-through on the Bullet Chart control and its features.
Orientation
The Bullet Chart component renders in both vertical and horizontal directions, which will be helpful when viewing a chart on different devices.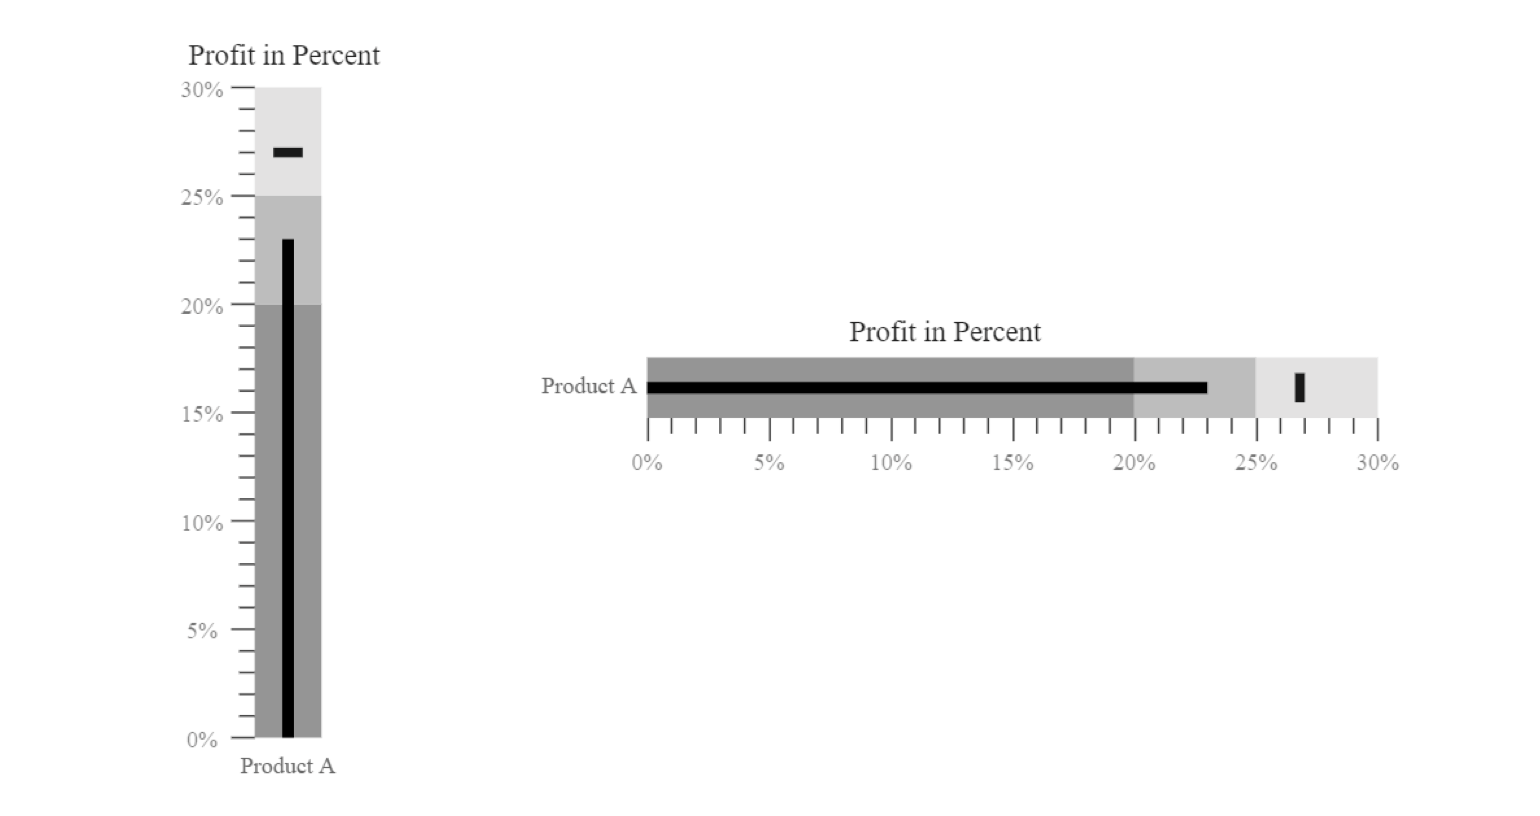
Multiple targets
The Bullet Chart allows us to compare the measures with multiple targets.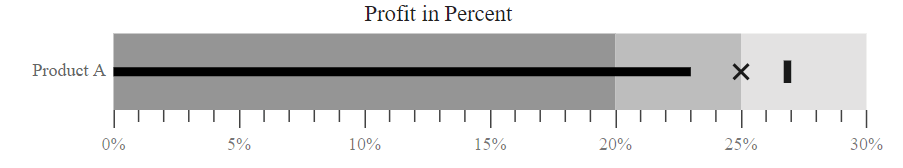
Multiple measures
Bullet chart allows the comparison of several measures at once.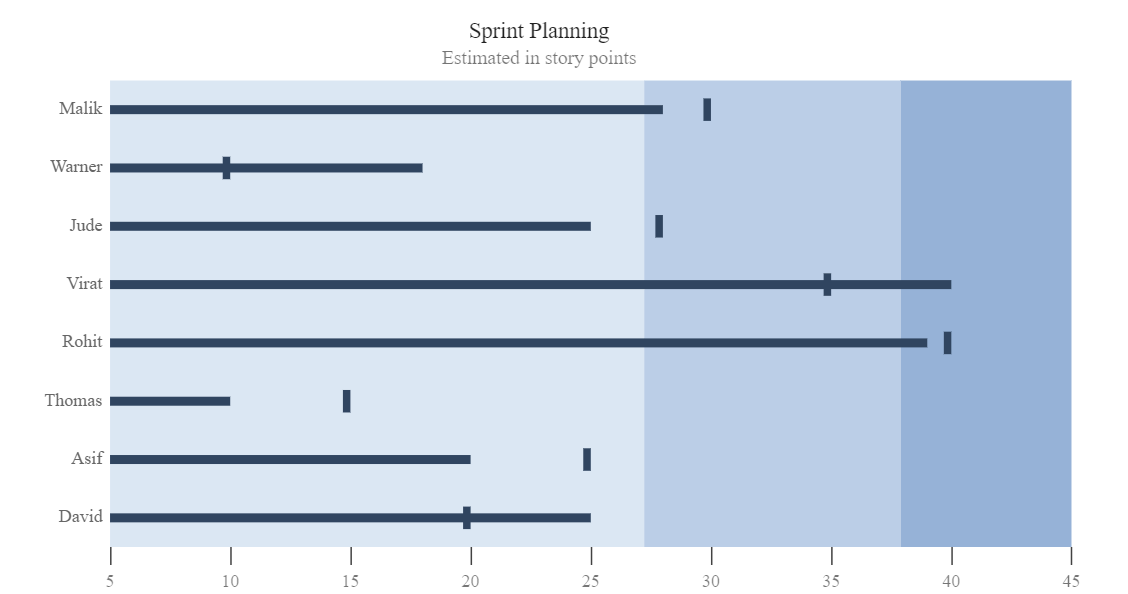
Ranges
The qualitative ranges in a bullet chart help measure the performance of data. Each color of the range represents a quality such as good, bad, and acceptable.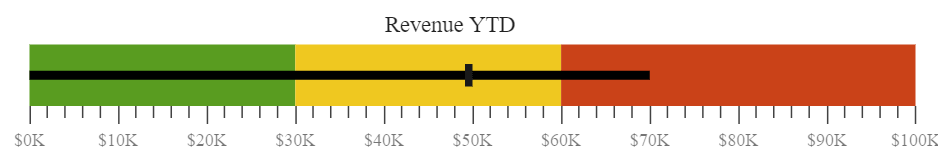
Labels and ticks
Ticks are the major scale indicators of a bullet chart, and labels will be placed on the major ticks. You can apply a range’s color to the ticks and labels that are associated with it.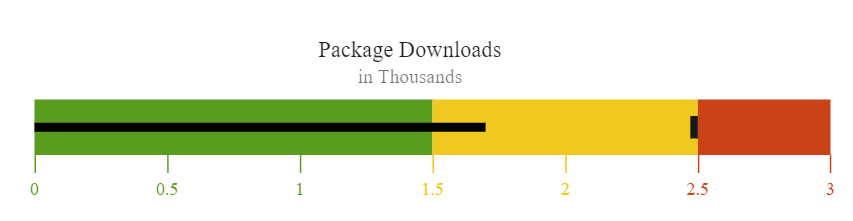
Tooltip
The Bullet Chart lets you display details about measures and targets through a tooltip that appears when hovering the mouse over the measures.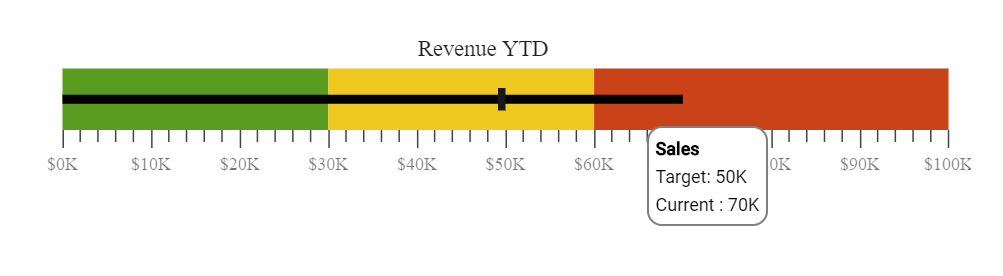
Customization
We can configure the look and feel of a bullet chart to match requirements using several built-in options. The control supports the following themes:
- Fabric
- Material
- High contrast
- Bootstrap
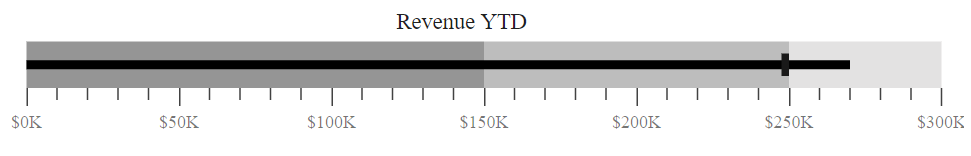
Getting started with the Bullet Chart in TypeScript
Let’s create a bullet chart to visualize and compare measures. The Bullet Chart control can be configured in TypeScript as follows:
- Clone the Essential JS 2 quick-start seed repository and configure the necessary package in the config.js file.
"@syncfusion/ej2-base": "syncfusion:ej2-base/dist/ej2-base.umd.min.js",

"@syncfusion/ej2-data": "syncfusion:ej2-data/dist/ej2-data.umd.min.js",

"@syncfusion/ej2-charts": "syncfusion:ej2-charts/dist/ej2-charts.umd.min.js",

"@syncfusion/ej2-svg-base": "syncfusion:ej2-svg-base/dist/ej2-svg-base.umd.min.js"
- Install the NPM packages by using the following command.
npm install
- Add the HTML input element that needs to be initialized as a component in the htmlfile.
- Initialize the component in the ts file as shown in the following code.
import { BulletChart } from '@syncfusion/ej2-charts';

// initialize bullet chart component
let chart: BulletChart = new BulletChart(
{
     dataSource: [{ value: 270, target: 250 }],
     valueField: 'value',
     targetField: 'target',
     ranges: [{end : 150}, {end : 250}, {end : 300}],
     title: Revenue YTD,
}
);

// render initialized bullet chart
chart.appendTo('#container');
 You can find the live demo of this project here.
Conclusion
We hope you will find the Bullet Chart component user-friendly, and we look forward to you trying it out. You can find the Essential JS 2 install download link on our website. Also, you can check out the Bullet Chart source on GitHub. Please take a look at our live demos in our sample browser, and customization features in our documentation.
The JavaScript Bullet Chart component is also available for the React, Angular, ASP.NET Core, Blazor and MVC frameworks, built from their own TypeScript libraries.
If you wish to send us feedback or would like to ask any questions, please feel free to post in the comments section below, or contact us through our support forum, Direct-Trac, or feedback portal.


If you like this blog post, we think you’ll also like the following free ebooks!
 No spam, just valuable updates.