
Dashboards are useless without lots of data from all available sources.
Data is the weapon (not necessarily of choice) being used to wage today’s competitive battles. Companies that put their data to good use are going to dominate the future.
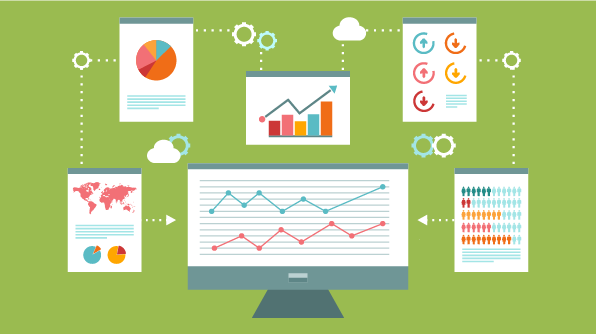
Dashboards are everywhere
Dashboards are a powerful tool when it comes to understanding and using data in a productive manner. More and more organizations are realizing that being able to display key performance indicators in a visual fashion and securely sharing the information with stakeholders helps improve outcomes. This is expected, as you cannot improve what you do not track.
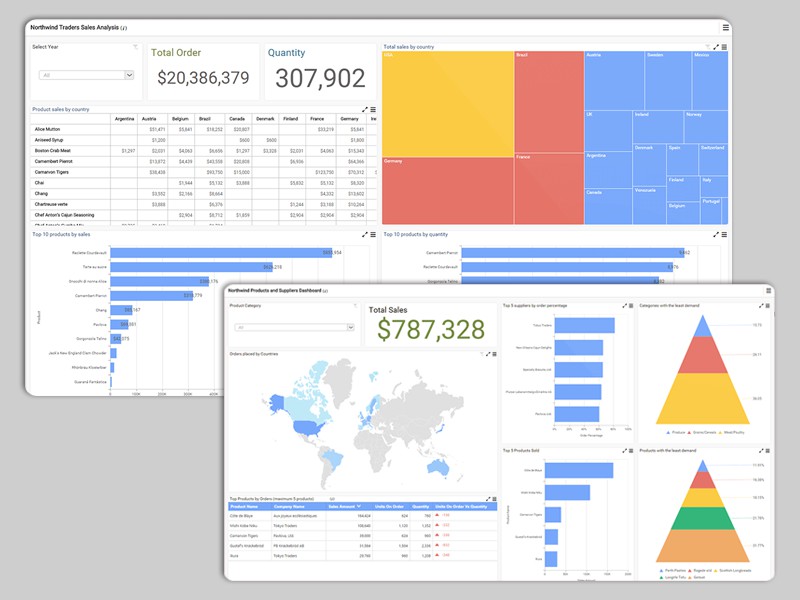
The good news is that it is relatively easy to find a dashboard solution that will fit most needs. There are several dashboard solutions available on the market. Most solutions offer similar features. You can typically perform simple transformations on data and present it in a visually appealing manner using a drag and drop designer interface. The dashboard thus produced can be deployed to a server for distribution in tandem with a directory system as Active Directory. You can pick the platform that serves your needs and works for your budget.
Bringing data together is hard work
Picking a dashboard, however, is not the end of the story. Far from it. Dashboards need data. Lots of it. They need all available data from every nook and corner of your enterprise. Data sings, but only as part of a choir.
Image from Pixabay.com
Data in today lives in varied data stores such as SQL Server, Oracle, PostgreSQL, MySQL, IBM Db2, Apache Cassandra, MongoDB, Microsoft Excel files, CSV files, and others. Bringing this data together in a form that will allow you to produce useful dashboards is no small task. You will have to deal with the task of integration, clean up, reconciliation, and secure storage of the resulting data. The process you come up with will have to run on a schedule to keep data up to date. In fact, this is where most of the messy work lurks.
Data integration – you’re on your own
You would think that since data integration is something every successful dashboard deployment requires, most dashboards would come with software that would allow such integration out of the box. Far from it. Most dashboards ship with very basic Extract, Transform, Load (ETL) functions, if any. Such simple ETL works great for demo software but fails miserably when presented with real-world challenges.
Syncfusion Data Integration Platform – for all your data integration needs
The Syncfusion Dashboard Platform is unique in this respect. Not only is it one of the most powerful, elaborate, and mobile-enabled dashboard platforms available (at any price), it is complemented by a complete data integration platform. Syncfusion’s Data Integration Platform allows you to easily integrate data from multiple data sources. You can perform complex integration tasks without writing any code. There are out-of-the-box processors for all your data handling needs. There is also support for custom processors.
Data to dashboard – video walkthrough
We have created a video that walks through the process of going from multiple data stores into a single de-normalized table that is suitable for analytics. The data is then displayed using a dashboard, all with a few clicks.
Data to Dashboard Using the Syncfusion Data Integration Platform: http://bit.ly/2zlOpVz
Complete List of Tutorials on the Syncfusion Dashboard Platform: http://bit.ly/2AhJDoU
 No spam, just valuable updates.