
TL;DR: Manually creating flowcharts in Excel is tedious and error-prone. This beginner-friendly guide demonstrates how to automate flowchart in Excel using C# with Syncfusion’s .NET Excel library. Learn to insert shapes, connect them with arrows, apply styling, and generate a complete order fulfillment workflow through clean, maintainable code.
Why automate flowchart in Excel using C#
Flowcharts are vital for visualizing processes like order fulfillment, approval workflows, and data pipelines. They help teams quickly grasp complex logic. But building them manually in Excel is time-consuming and prone to mistakes, especially when workflows change frequently or need to be generated dynamically from data.
By automating flowchart creation with C#, you can:
- Save time by generating diagrams programmatically
- Ensure accuracy and consistency across reports
- Integrate with business systems for real-time updates
- Scale easily for large or frequently updated workflows
The Syncfusion .NET Excel library makes this possible by allowing you to add and format shapes directly in Excel documents.
In this blog, you’ll learn how to automate flowchart creation in Excel using simple, maintainable code. You’ll learn how to add shapes, connectors, and styling to build a complete order fulfillment workflow without opening Excel manually.
Why choose Syncfusion .NET Excel library?
The .NET Excel Library, also known as Essential XlsIO, is a robust tool for creating and managing Excel documents using C# without relying on Microsoft Office. It supports:
- Creating Excel files from scratch
- Editing existing documents
- Adding shapes, form controls, and comments
- Importing/exporting data
- Using formulas, conditional formatting, and data validations
- Creating Charts, Sparklines, Tables, Pivot Tables, and more
Common use cases of flowcharts
- Order fulfillment workflow to visualize steps from order receipt to shipping for e-commerce systems.
- Approval processes to automate diagrams for leave requests, expense approvals, or document sign-offs.
- Data pipeline visualization for representing ETL (Extract, Transform, Load) stages in analytics workflows.
- IT incident management to redirect escalation paths for system alerts and troubleshooting.
- Manufacturing process flow for show production stages, quality checks, and packaging steps.
Let’s create an order fulfillment workflow flowchart using Syncfusion .NET Excel library and C#.
Prerequisites
To follow along, you’ll need:
Steps to create an order fulfillment flowchart
Step 1: Create a .NET application
Create a new .NET Core console application in Visual Studio.
Step 2: Install the NuGet packages
Install the latest Syncfusion.XlsIO.Net.Core NuGet package.
Step 3: Required Namespaces
To use the Syncfusion Excel library, add the following namespaces to the Program.cs file.
using Syncfusion.XlsIO;
using Syncfusion.Drawing;
Step 4: Add flowchart shapes
We create a method to add flow chart shapes to the Excel worksheet.
public static IShape AddFlowChartShape(IWorksheet worksheet, int row, int col, int height, int width, string text, AutoShapeType flowChartShapeType)
{
    // Create the shape anchored at (row, col)
    IShape flowChartShape = worksheet.Shapes.AddAutoShapes(flowChartShapeType, row, col, height, width);

    // Basic style
    flowChartShape.Line.Weight = 1.25;

    // Content & alignment
    flowChartShape.TextFrame.TextRange.Text = text;
    flowChartShape.TextFrame.HorizontalAlignment = ExcelHorizontalAlignment.CenterMiddle;
    flowChartShape.TextFrame.VerticalAlignment = ExcelVerticalAlignment.Middle;

    return flowChartShape;
}
Step 5: Add labels
We create a method to add flow chart labels to the worksheet.
public static IShape AddLabel(IWorksheet worksheet, int row, int col, string text)
{
    IShape rectangle = worksheet.Shapes.AddAutoShapes(AutoShapeType.Rectangle, row, col, 14, 40);

    // Make it text-only
    rectangle.Fill.Transparency = 1f;
    rectangle.Line.Visible = false;

    // Content & alignment
    rectangle.TextFrame.TextRange.Text = text;
    rectangle.TextFrame.HorizontalAlignment = ExcelHorizontalAlignment.CenterMiddle;
    rectangle.TextFrame.VerticalAlignment = ExcelVerticalAlignment.Middle;

    // Nudge to the right to avoid overlapping connectors
    rectangle.Left += 30;

    return rectangle;
}
Step 6: Add connectors
We create methods to add connectors and calculate connector points.
public static IShape Connect(IWorksheet worksheet, IShape from, int fromSite, IShape to, int toSite, bool isEnd)
{
    // Absolute positions (in points) on the worksheet
    PointF startPoint = GetConnectionPoint(from, fromSite);
    PointF endPoint = GetConnectionPoint(to, toSite);

    // Bounding box for the straight connector
    float left = Math.Min(startPoint.X, endPoint.X);
    float top = Math.Min(startPoint.Y, endPoint.Y);
    double width = Math.Abs(endPoint.X - startPoint.X);
    double height = Math.Abs(endPoint.Y - startPoint.Y);

    // Draw a straight connector and place it
    IShape connector = worksheet.Shapes.AddAutoShapes(AutoShapeType.StraightConnector, 1, 1, (int)height, (int)width);
    connector.Left = (int)left;
    connector.Top = (int)top;

    // Arrow style
    if (isEnd)
        connector.Line.EndArrowHeadStyle = ExcelShapeArrowStyle.LineArrow;
    else
        connector.Line.BeginArrowHeadStyle = ExcelShapeArrowStyle.LineArrow;

    connector.Line.Weight = 1.25;
    return connector;
}
private static PointF GetConnectionPoint(IShape shape, int site)
{
    float x = shape.Left;
    float y = shape.Top;

    switch (site)
    {
        case 0: // Top
            x += shape.Width / 2;
            break;
            case 1: // Right
                x += shape.Width;
                y += shape.Height / 2;
                break;
            case 2: // Bottom
                x += shape.Width / 2;
                y += shape.Height;
                break;
            case 3: // Left
                y += shape.Height / 2;
                break;
            default: // Center
                x += shape.Width / 2;
                y += shape.Height / 2;
                break;
        }

        return new PointF(x, y);
    }
}Step 7: Create the flowchart
Use the helper methods to add shapes, connectors, and labels for the order fulfillment workflow. Apply custom colors and save the workbook using the following code.
// Initialize ExcelEngine
using (ExcelEngine excelEngine = new ExcelEngine())
{
    // Use XLSX format by default
    IApplication application = excelEngine.Excel;
    application.DefaultVersion = ExcelVersion.Xlsx;

    // Create a new workbook with one worksheet
    IWorkbook workbook = application.Workbooks.Create(1);
    IWorksheet worksheet = workbook.Worksheets[0];

    // Name & present the canvas
    worksheet.Name = "Order Fulfillment Workflow";
    worksheet.IsGridLinesVisible = false;

    // ----- Shapes (row/col are 1-based anchors; height/width are in points) -----
    // Center column = 9, Right column = 14, as per your layout.
    IShape start = AddFlowChartShape(worksheet, 2, 9, 50, 170, "Start", AutoShapeType.FlowChartTerminator);
    IShape receiveOrder = AddFlowChartShape(worksheet, 6, 9, 50, 170, "Receive Order", AutoShapeType.FlowChartProcess);
    IShape checkInv = AddFlowChartShape(worksheet, 10, 9, 50, 170, "Check Inventory", AutoShapeType.FlowChartProcess);
    IShape invAvailable = AddFlowChartShape(worksheet, 14, 9, 50, 170, "Inventory Available?", AutoShapeType.FlowChartDecision);

    // No branch (left/vertical)
    IShape noNotify = AddFlowChartShape(worksheet, 18, 9, 50, 170, "Notify Customer", AutoShapeType.FlowChartProcess);
    IShape backOrCan = AddFlowChartShape(worksheet, 24, 9, 50, 170, "Backorder or Cancel", AutoShapeType.FlowChartProcess);
    IShape leftEnd = AddFlowChartShape(worksheet, 30, 9, 50, 170, "End", AutoShapeType.FlowChartTerminator);

    // Yes branch (right/vertical)
    IShape payment = AddFlowChartShape(worksheet, 14, 14, 50, 170, "Process Payment", AutoShapeType.FlowChartProcess);
    IShape packed = AddFlowChartShape(worksheet, 18, 14, 50, 170, "Pack Order", AutoShapeType.FlowChartProcess);
    IShape shipped = AddFlowChartShape(worksheet, 24, 14, 50, 170, "Ship Order", AutoShapeType.FlowChartProcess);
    IShape yesNotify = AddFlowChartShape(worksheet, 30, 14, 50, 170, "Notify Customer", AutoShapeType.FlowChartProcess);

    // ----- Connectors -----
    // Decision → branches: fromSite/toSite mapping (0:Top, 1:Right, 2:Bottom, 3:Left)
    Connect(worksheet, start, 2, receiveOrder, 0, true);
    Connect(worksheet, receiveOrder, 2, checkInv, 0, true);
    Connect(worksheet, checkInv, 2, invAvailable, 0, true);
    Connect(worksheet, invAvailable, 1, payment, 3, true);
    Connect(worksheet, invAvailable, 2, noNotify, 0, true);

    // Left chain (No branch)
    Connect(worksheet, noNotify, 2, backOrCan, 0, true);
    Connect(worksheet, backOrCan, 2, leftEnd, 0, true);

    // Right chain (Yes branch)
    Connect(worksheet, payment, 2, packed, 0, true);
    Connect(worksheet, packed, 2, shipped, 0, true);
    Connect(worksheet, shipped, 2, yesNotify, 0, true);
    Connect(worksheet, yesNotify, 3, leftEnd, 1, false); // Left to End; arrow at beginning to indicate flow into End

    // ----- Decision branch labels -----
    // "Yes" near the right-going branch from the decision
    AddLabel(worksheet, 14, 12, "Yes");

    // "No" near the downward branch from the decision
    AddLabel(worksheet, 17, 9, "No");

    // Colors
    Color colorTerminator = ColorTranslator.FromHtml("#10B981"); // Emerald 500
    Color colorProcess = ColorTranslator.FromHtml("#3B82F6"); // Blue 500
    Color colorDecision = ColorTranslator.FromHtml("#F59E0B"); // Amber 500
    Color colorShip = ColorTranslator.FromHtml("#8B5CF6"); // Violet 500
    Color colorNotify = ColorTranslator.FromHtml("#14B8A6"); // Teal 500
    Color colorLine = ColorTranslator.FromHtml("#1F2937"); // Slate 800 (borders/connectors)
    Color colorAccent = ColorTranslator.FromHtml("#2563EB"); // Blue 600 (reserved if needed)

    // Apply fills (lines are set in AddFlowChartShape)
    start.Fill.ForeColor = colorTerminator;
    receiveOrder.Fill.ForeColor = colorProcess;
    checkInv.Fill.ForeColor = colorProcess;
    invAvailable.Fill.ForeColor = colorDecision;

    noNotify.Fill.ForeColor = colorNotify;
    backOrCan.Fill.ForeColor = colorNotify;
    leftEnd.Fill.ForeColor = colorTerminator;

    payment.Fill.ForeColor = colorProcess;
    packed.Fill.ForeColor = colorProcess;
    shipped.Fill.ForeColor = colorShip;
    yesNotify.Fill.ForeColor = colorNotify;

    // Save the workbook
    string outputPath = Path.Combine(Environment.CurrentDirectory, "OrderFulfillmentFlowchart.xlsx");
    workbook.SaveAs(outputPath);
}
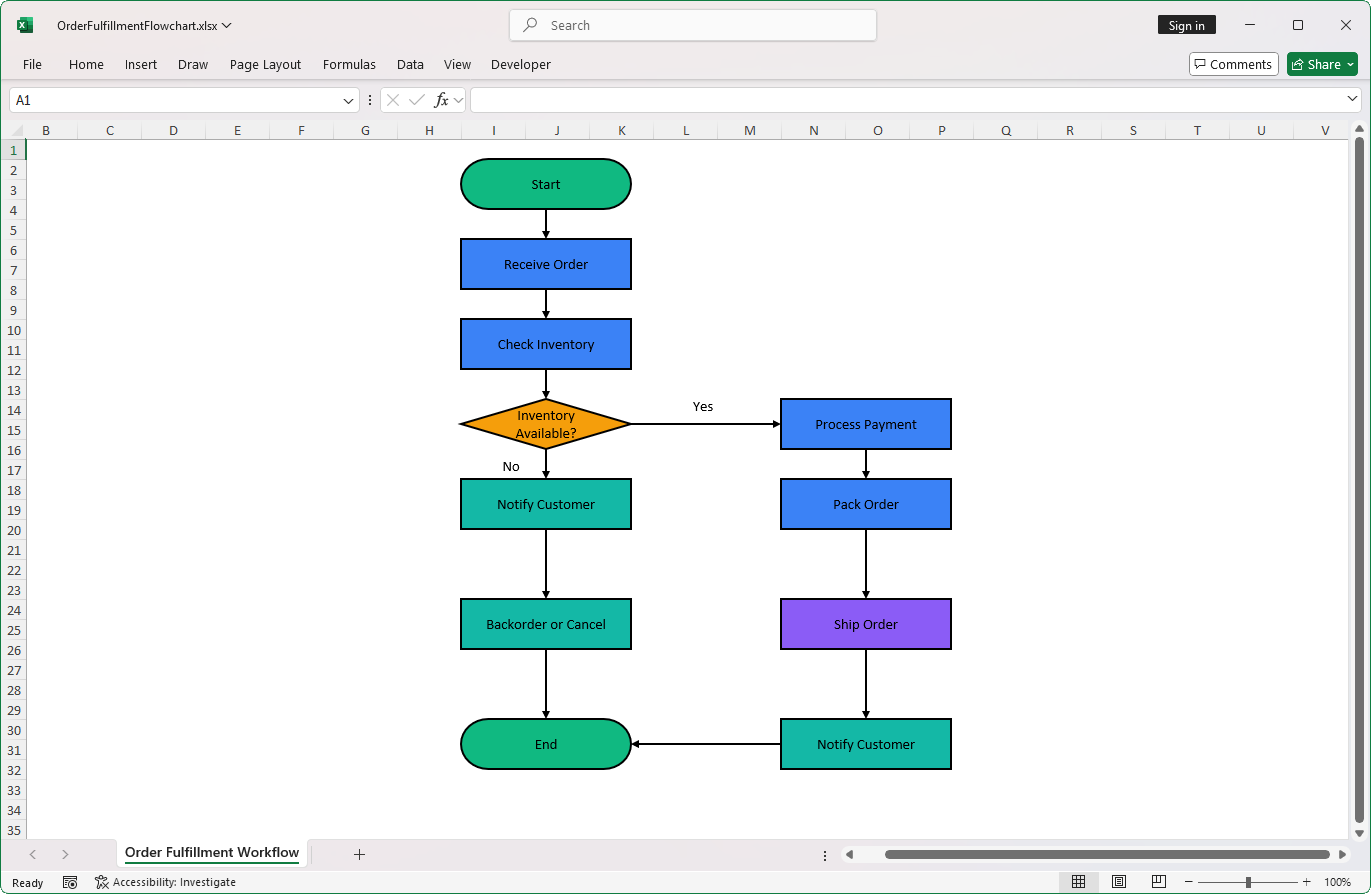
The final Excel file will contain a fully formatted order fulfillment flowchart, complete with connectors and labels as shown in the screenshot below.
GitHub reference
You can download the complete samples from the GitHub demo.
Conclusion
Thank you for reading! This blog post explored how the Syncfusion Excel Library (XlsIO) can easily create flowcharts using shapes in an Excel document using C#. You can check the flowchart documentation here.
Explore the documentation for additional options and features, each with code samples. Using the library, you can also export or write Excel data to PDF, images, data tables, HTML, CSV, TSV, collections of objects, ODS, and JSON. For more insights, please refer to our online demos.
We highly recommend following our getting started guide if you are new to our .NET Excel library.
If you’re a Syncfusion user, you can download the product setup from the license and downloads page. Otherwise, you can try our 30-day free trial to try them out.
Do you have queries? Drop them in the comments or reach out via our support channels: support forum, support portal, or Feedback Portal. We are always happy to assist you!


 No spam, just valuable updates.