

TL;DR: Static spreadsheets break down quickly in dynamic production environments. This guide shows how to build a web-based production planning system in React that connects demand planning, MRP, production scheduling, capacity planning, and real-time KPI dashboards, all within a familiar spreadsheet-like interface using components from Syncfusion. Learn how to design scalable workflows, manage state efficiently, and deliver responsive, production-ready manufacturing insights.
Why static Spreadsheets fall short for production planning
Many manufacturing teams begin production planning in Excel or Google Sheets because they’re familiar and easy to set up.
But as operations scale and data become more dynamic, static spreadsheets quickly reveal their limitations. Common issues include:
- Version conflicts: Multiple planners update different copies of the same file, resulting in mismatched plans and lost work.
- Formula fragility: A single accidental edit can break dependencies used for MRP, capacity calculations, and order prioritization.
- Lack of validation: Incorrect dates, invalid quantities, or incomplete order details slip through unnoticed.
- Stale dashboards: KPIs and charts update only when refreshed manually, leading to decisions based on outdated information.
What makes a web-based production planning Spreadsheet better
A web‑based spreadsheet editor centralizes logic, protects critical ranges, enforces validation, and updates instantly, without losing the familiar spreadsheet experience planners rely on.
Key benefits for manufacturing teams
- Familiar Excel‑like editing with real‑time recalculation.
- Single source of truth for demand, materials, schedules, and KPIs.
- Always‑current manufacturing dashboards.
Key benefits for developers
- Centralized formulas and validations (no broken logic).
- Role‑based editing and protected ranges.
- Fully controllable via React APIs.
Production planning with Syncfusion React web-based Spreadsheet Editor
Syncfusion React Spreadsheet Editor provides production teams with a streamlined, browser‑based way to plan and organize their work. It allows planners to create dedicated sheets for demand, materials, capacity, schedules, and dashboards, each one linked together as part of a unified workflow. Because the interface works just like a familiar spreadsheet, planners can quickly enter or adjust data and instantly see how those changes ripple through the rest of the plan.
Plus, it offers the guardrails developers need:
- Built-in validation
- Protected formulas
- Conditional formatting
- Role-based editing
- Connected multi-sheet workflows
This results in smoother order management, reliable production scheduling, informed capacity planning, and accurate material planning, all in one place. Create Excel-style data experiences in React with built-in formula support, cell formatting, workbook editing, large dataset handling, and seamless spreadsheet viewing.
What we’ll build
In this blog, we’ll show how to upgrade your production planning from static sheets to a modern web-based spreadsheet editor by building a connected demand-to-schedule workflow with Syncfusion React Spreadsheet. You’ll see how the Demand, Material Planning (MRP), Scheduling, and Dashboard sheets work together to keep your production plan clear, consistent, and ready for real manufacturing operations.
Quick setup
You can set up the Syncfusion React Spreadsheet Editor for production planning in just a few steps. The following steps help you load the Spreadsheet component and prepare the workspace for adding your planning sheets.
Step 1: Create a new React project
Start by creating a new React application using Vite:
npm create vite@latest my-app -- --template react
cd my-app
npm run dev
This gives you a lightweight and fast development environment suitable for building this interface.
Step 2: Install the Syncfusion React Spreadsheet package
Next, install the Syncfusion React Spreadsheet Editor using the following NPM command:
npm install @syncfusion/ej2-react-spreadsheet --saveThis package provides all the core spreadsheet functionality, including formulas, validation, charts, and sheet management.
Step 3: Add required Syncfusion CSS styles
Now, import the required Syncfusion CSS files to ensure the Spreadsheet Editor renders correctly with the Material theme:
@import '../node_modules/@syncfusion/ej2-base/styles/material.css';
@import '../node_modules/@syncfusion/ej2-inputs/styles/material.css';
@import '../node_modules/@syncfusion/ej2-buttons/styles/material.css';
@import '../node_modules/@syncfusion/ej2-splitbuttons/styles/material.css';
@import '../node_modules/@syncfusion/ej2-lists/styles/material.css';
@import '../node_modules/@syncfusion/ej2-navigations/styles/material.css';
@import '../node_modules/@syncfusion/ej2-popups/styles/material.css';
@import '../node_modules/@syncfusion/ej2-dropdowns/styles/material.css';
@import '../node_modules/@syncfusion/ej2-grids/styles/material.css';
@import '../node_modules/@syncfusion/ej2-react-spreadsheet/styles/material.css';
These styles ensure consistent UI behavior across inputs, dropdowns, grids, and spreadsheet elements.
Step 4: Load the Spreadsheet component
Finally, render the Spreadsheet component in your application.
import * as React from 'react';
import { SpreadsheetComponent } from '@syncfusion/ej2-react-spreadsheet';
import './App.css';
export default function App() {
    return  (<SpreadsheetComponent/>);}
Once loaded, you can begin configuring production planning features such as formulas, data validation, conditional formatting, multiple sheets, and toolbar or ribbon customization. All of these capabilities are fully controllable through the Syncfusion API.
For deeper configuration options, developers can follow the Syncfusion React Spreadsheet User Guide.
Workflow architecture: Clear roles, clean handoffs
This production planning system uses a simple, role‑based workflow that mirrors real manufacturing operations. Here, each person updates only the parts of the spreadsheet they own. This keeps the plan accurate, organized, and easy to maintain.
Defined roles in the workflow
- Planner
Responsible for entering customer demand, running material planning calculations, and creating the draft production schedule. Planner inputs drive all downstream sheets. - Supervisor
Updates shop‑floor actuals such as production output, downtime, and variances, ensuring schedules and dashboards reflect real execution. - Manager
Reviews KPIs on the dashboard, monitors delayed or at‑risk orders, and approves the final production plan.
This clear separation of responsibilities reduces update conflicts, prevents accidental data changes, and ensures the entire production planning workflow remains connected, up to date, and auditable.
Build the production planning workflow (Sheet-by-sheet breakdown)
The production planning system is organized as a connected set of focused worksheets, each with a clear responsibility. Together, these sheets form an end‑to‑end demand‑to‑schedule workflow that mirrors how real manufacturing operations run.
By separating demand, materials, scheduling, and performance tracking into dedicated sheets, teams gain better visibility, reduce conflicts, and ensure that changes propagate cleanly across the entire plan.
Workflow structure: At a glance
- Demand → What needs to be produced and by when.
- Material Planning (MRP) → Whether materials are available to meet demand.
- Scheduling → When production should start and finish.
- Dashboard → How well the plan is performing in real-time.
Sheet 1: Demand Sheet: Customer order management
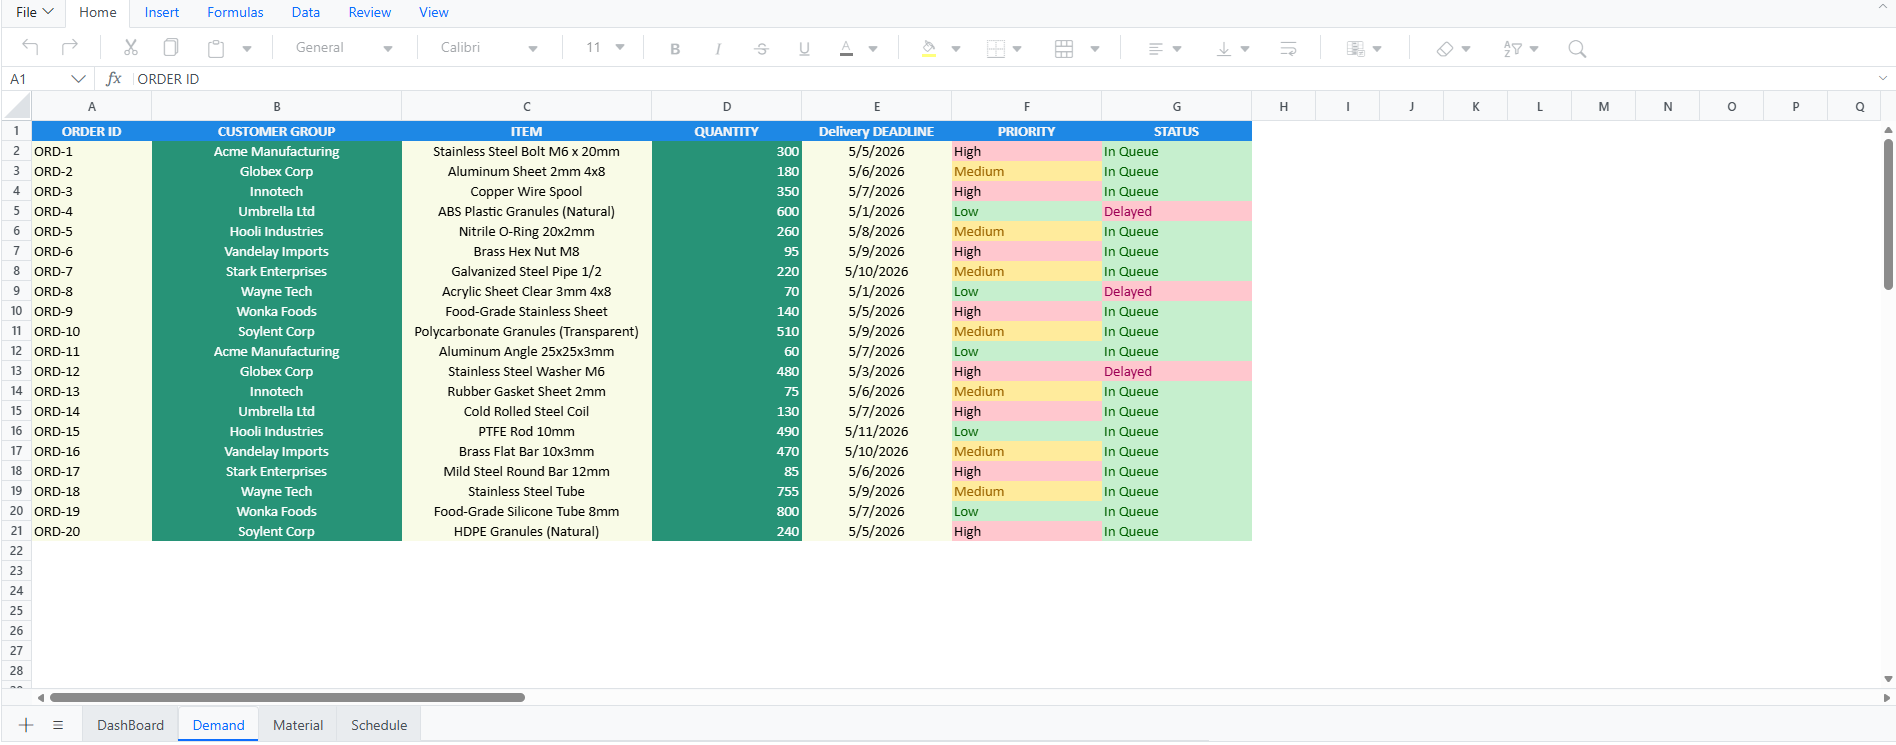
The Demand Sheet is where every customer order begins. Each new entry automatically gets a unique Order ID, ensuring clean tracking across all downstream sheets. Planners can enter essential order details, quantity, due date, and priority with priority selected through a simple dropdown for consistent data entry.
The sheet dynamically updates each order’s status using automated rules. Labels such as In Queue, Delayed, or Delivered adjust based on due dates and actual progress, giving planners an instant view of which orders require attention.
Any updates to the Demand Sheet, such as quantity changes, due‑date adjustments, or priority shifts, are immediately reflected in the Material Planning and Scheduling sheets. This keeps the entire workflow synchronized, accurate, and responsive to changing customer needs.
Refer to the following code to apply priority validation and status highlighting in the Demand sheet.
// Apply dropdown validation for Priority (High / Medium / Low)
spreadsheet.addDataValidation(
  { type: 'List', value1: 'High,Medium,Low' },
  `Demand!F2:F${demandLastRow}`
);

// Highlight rows where Status equals "Delayed"
spreadsheet.conditionalFormat({
  type: 'EqualTo',
  value: 'Delayed',
  range: `Demand!G2:G${demandLastRow}`,
  format: {
    backgroundColor: 'red',
    color: '#721C24'
  }
});
Below is the output image of the demand sheet.
Sheet 2: Material planning sheet: MRP calculation
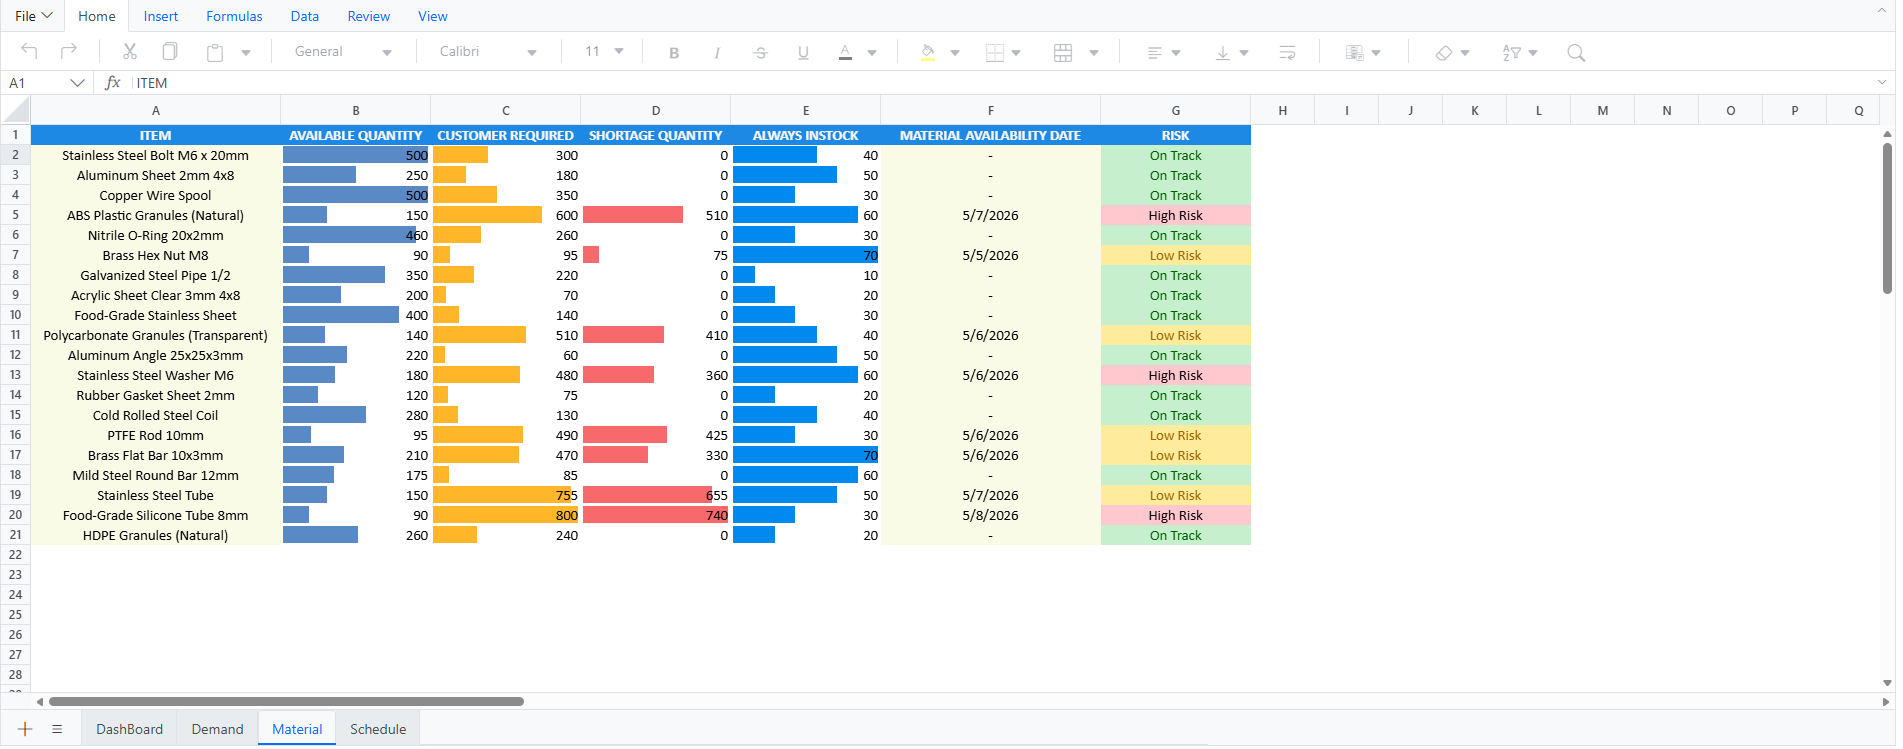
The Material Planning Sheet gives planners a real‑time view of whether enough material is available to meet upcoming customer orders. It compares the Required Quantity from the Demand Sheet against On‑Hand and In‑Stock quantities to automatically flag shortages. When a shortage appears, a simple formula simulates an expected delivery date so planners know when materials are likely to arrive.
To highlight issues quickly, each item is marked High, Medium, or Low risk based on shortage levels and delivery timing, updating automatically if expected dates slip. Any changes in the demand sheet, such as quantity updates or revised timelines, instantly reflect here, keeping all MRP data accurate and current.
Here’s the code example to implement material‑calculation formulas across all rows in the Material sheet.
// Populate Material sheet: compute required qty, shortage, procurement, expected date, and risk per item
for (let r = 1; r <= DATA_ROWS; r++) {
  const rowNum = r + 1;

  // Required = sum of Demand quantities for this item
  spreadsheet.updateCell(
    {
      formula: `=SUMIF(Demand!C2:C${demandLastRow},Material!A${rowNum},Demand!D2:D${demandLastRow})`
    },
    `Material!C${rowNum}`
  );

  // Shortage = max(0, Required - OnHand)
  spreadsheet.updateCell(
    {
      formula: `=MAX(0,C${rowNum}-B${rowNum})`
    },
    `Material!D${rowNum}`
  );

  // Procurement qty = shortage (else 0)
  spreadsheet.updateCell(
    {
      formula: `=IF(D${rowNum}>0,D${rowNum},0)`
    },
    `Material!E${rowNum}`
  );

  // Expected delivery = today + simple lead time (1 day per 100 units) if shortage
  spreadsheet.updateCell(
    {
      formula: `=IF(D${rowNum}>0,TODAY()+CEILING(D${rowNum}/100,1),TODAY())`
    },
    `Material!F${rowNum}`
  );

  // Risk level based on Priority and days until expected date
  spreadsheet.updateCell(
    {
      formula: `=IF(
        Demand!F${rowNum}="High",
        IF(E${rowNum}-TODAY()<=2,"High Risk","On Track"),
        IF(
          Demand!F${rowNum}="Medium",
          IF(E${rowNum}-TODAY()<=3,"Medium Risk","On Track"),
          IF(
            Demand!F${rowNum}="Low",
            IF(E${rowNum}-TODAY()<=5,"Low Risk","On Track"),
            "On Track"
          )
        )
      )`
    },
    `Material!G${rowNum}`
  );
}
See the output image for reference.
Sheet 3: Scheduling sheet: Production schedule builder
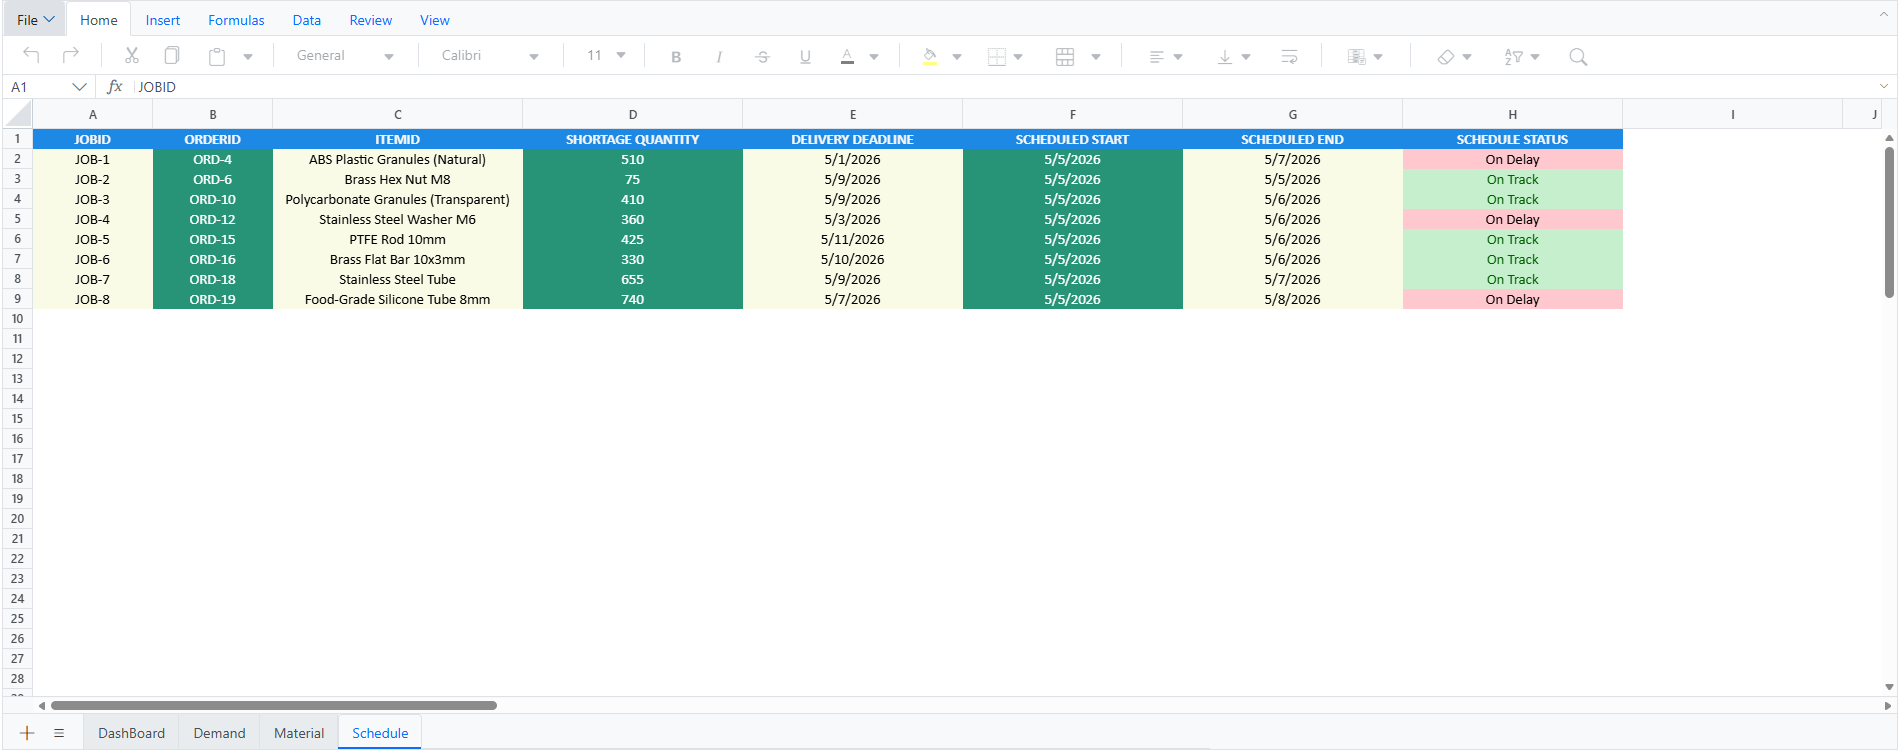
The Scheduling sheet converts demand and material readiness into a clear time‑phased production plan. It creates job entries with a unique Job ID only for items with confirmed material shortages or readiness triggers in the MRP sheet, keeping the schedule focused and free of clutter.
Planned Start and Planned End dates are calculated automatically based on expected material arrival, ensuring production begins on time. Job status, On Track, At Risk, or Delayed, updates by comparing the Planned End date with each order’s Due Date.
Code snippet to calculate planned dates and job status in the scheduling sheet.
// Loop through each row to populate the Scheduling sheet with order details,
// calculate planned dates, and determine job status
for (let r = 1; r <= DATA_ROWS; r++) {
  const rowNum = r + 1;

  // Order ID from Demand
  spreadsheet.updateCell(
    { formula: `=Demand!A${rowNum}` },
    `Schedule!B${rowNum}`
  );

  // Item from Demand
  spreadsheet.updateCell(
    { formula: `=Demand!C${rowNum}` },
    `Schedule!C${rowNum}`
  );

  // Quantity from Demand
  spreadsheet.updateCell(
    { formula: `=Demand!D${rowNum}` },
    `Schedule!D${rowNum}`
  );

  // Due date from Demand
  spreadsheet.updateCell(
    { formula: `=Demand!E${rowNum}` },
    `Schedule!E${rowNum}`
  );

  // Expected material date from MRP (Material! column F)
  spreadsheet.updateCell(
    {
      formula: `=VLOOKUP(C${rowNum},Material!A2:G${materialLastRow},6,FALSE)`
    },
    `Schedule!F${rowNum}`
  );

  // Planned start = later of today or expected material date
  spreadsheet.updateCell(
    { formula: `=MAX(TODAY(),F${rowNum})` },
    `Schedule!G${rowNum}`
  );

  // Planned end = start + processing time (qty/10 hours → days)
  spreadsheet.updateCell(
    { formula: `=G${rowNum}+(D${rowNum}/10)/24` },
    `Schedule!H${rowNum}`
  );

  // Status = AT-RISK if planned end exceeds due date, else ON-TRACK
  spreadsheet.updateCell(
    {
      formula: `=IF(H${rowNum}>E${rowNum},"AT-RISK","ON-TRACK")`
    },
    `Schedule!I${rowNum}`
  );
}
Refer to the following image.
Sheet 4: Dashboard and tracking sheet: Real‑time KPIs
The Dashboard Sheet gives managers a real‑time view of production performance by pulling live data from the Demand, Material Planning, and Scheduling sheets. It displays key KPIs, including throughput, on-time delivery rate, delayed orders, and overall risk levels.
Interactive Charts update automatically whenever upstream data changes. As supervisors enter actual production output or variances, the dashboard refreshes instantly, no manual updates needed.
Here’s the code snippet used to insert charts into the dashboard.
// Column chart showing customer-ordered item
const ColumnChart = [
  {
    type: 'Column',
    range: `Demand!C1:D21`,
    title: 'CUSTOMER ORDERED ITEMS',
    theme: 'Tailwind3',
    height: 290,
    width: 450,
    top: 0,
    id: 'Chart2',
    isSeriesInRows: false
  }
];

// Pie chart showing order priority distribution
const PieChart = [
  {
    type: 'Pie',
    range: 'DashBoard!A11:B13',
    title: 'ORDER PRIORITIES',
    theme: 'Tailwind3',
    height: 290,
    width: 440,
    top: 0,
    id: 'Chart1',
    isSeriesInRows: false
  }
];

// Bar chart comparing available vs ordered quantities
const BarChart = [
  {
    type: 'Bar',
    range: 'Material!A1:C21',
    title: 'AVAILABLE AND CUSTOMER ORDERED QUANTITIES',
    theme: 'Tailwind3',
    height: 300,
    width: 900,
    top: 300,
    left: 370,
    id: 'Chart3',
    isSeriesInRows: false
  }
];

// Insert Pie and Column charts into specific dashboard cells
<CellsDirective>
  <CellDirective chart={PieChart} index={2}></CellDirective>
  <CellDirective chart={ColumnChart} index={4}></CellDirective>
</CellsDirective>

// Insert Bar chart into a lower dashboard cell
<CellsDirective>
  <CellDirective index={3} chart={BarChart}></CellDirective>
</CellsDirective>Data protection and role‑based validation
To keep the production planning workbook accurate, the system uses built‑in protection across all sheets. Critical formulas, reference ranges, and calculated fields are locked, preventing accidental edits and preserving the logic behind demand, MRP, and scheduling. Key inputs, such as dates, quantities, priorities, and material values, use data validation to block incorrect entries and maintain clean, reliable data.
Each sheet also follows role‑based editing rules, so planners, supervisors, and managers can update only the sections tied to their responsibilities. This controlled structure keeps the workflow consistent, reduces errors, and ensures the entire planning process stays organized, secure, and dependable.
We can enable workbook protection using the isProtected property with the following setup.
<SpreadsheetComponent
  ref={(ssObj) => {
    spreadsheet = ssObj;
  }}
  created={onCreated.bind(this)}
  height={650}
  showFormulaBar={false}
  isProtected={true}
  showRibbon={false}
>
</SpreadsheetComponent>
GitHub reference
Also, check out the complete production planning & scheduling using the web-based React Spreadsheet demo on GitHub.
Frequently Asked Questions
Can I customize the demand to schedule model for my factory?
Yes. Each sheet, Demand, Material Planning, Scheduling, and Dashboard, can be fully customized. You can modify formulas, add new columns, change validation rules, adjust status logic, or even build additional sheets based on your production workflow.
Does it handle large datasets?
Yes. The Syncfusion React Spreadsheet Editor is optimized for larger datasets through virtualization and efficient rendering. While performance depends on data size and browser limits, it reliably handles real‑world planning workloads.
Can multiple team members work on the planner at the same time?
Yes. Because it runs in the browser, different roles, planner, supervisor, and manager, can update their respective sheets without interfering with each other, especially when using role‑based validation.
Does the spreadsheet support real-time recalculation?
Absolutely. Any update made in the Demand Sheet instantly updates Material Planning, Scheduling, and Dashboard KPIs through formula linking.
Is this solution suitable for small and medium-sized manufacturers?
Definitely. It works well for small teams by replacing Excel and scales smoothly for larger production environments that need structured planning.
What features come with the Syncfusion Spreadsheet Editor SDK?
It includes Excel‑like formulas, data validation, conditional formatting, multiple sheets, protection, charts, import/export, and UI customization. For more information, refer to the user guide.
How easy is it to integrate the Spreadsheet Editor into a web application?
Integration is simple. You can add it using a few lines of code and configure it using built‑in APIs and components.
Does the Syncfusion Spreadsheet Editor support custom formulas?
Yes. You can create your own custom formulas using the Spreadsheet Editor’s custom function APIs.
From static spreadsheets to smarter production planning
Thanks for reading! A production planning spreadsheet doesn’t have to be fragile.
With Syncfusion React Spreadsheet, you can build a web‑based production planning system that:
- Scales beyond Excel limitations.
- Preserves spreadsheet familiarity.
- Adds automation, validation, and real‑time dashboards.
This approach works for small manufacturers replacing Excel and larger teams needing structured planning without complex ERP rollouts.
Ready to build your own production planning Spreadsheet?
👉 Explore the Syncfusion React Spreadsheet Editor and demo.
If you’re a Syncfusion user, you can download the setup from the license and downloads page. Otherwise, you can download a free 30-day trial.
You can also contact us through our support forum, support portal, or feedback portal for queries. We are always happy to assist you!


 No spam, just valuable updates.