
TL;DR: Build an AI-assisted Heatmap in WPF that automatically highlights critical areas using Syncfusion controls and an AI-powered data workflow. This guide walks you through layout design, data binding, color mapping, and real-time insights with a clean developer-first approach.
Welcome to our Chart of the Week series!
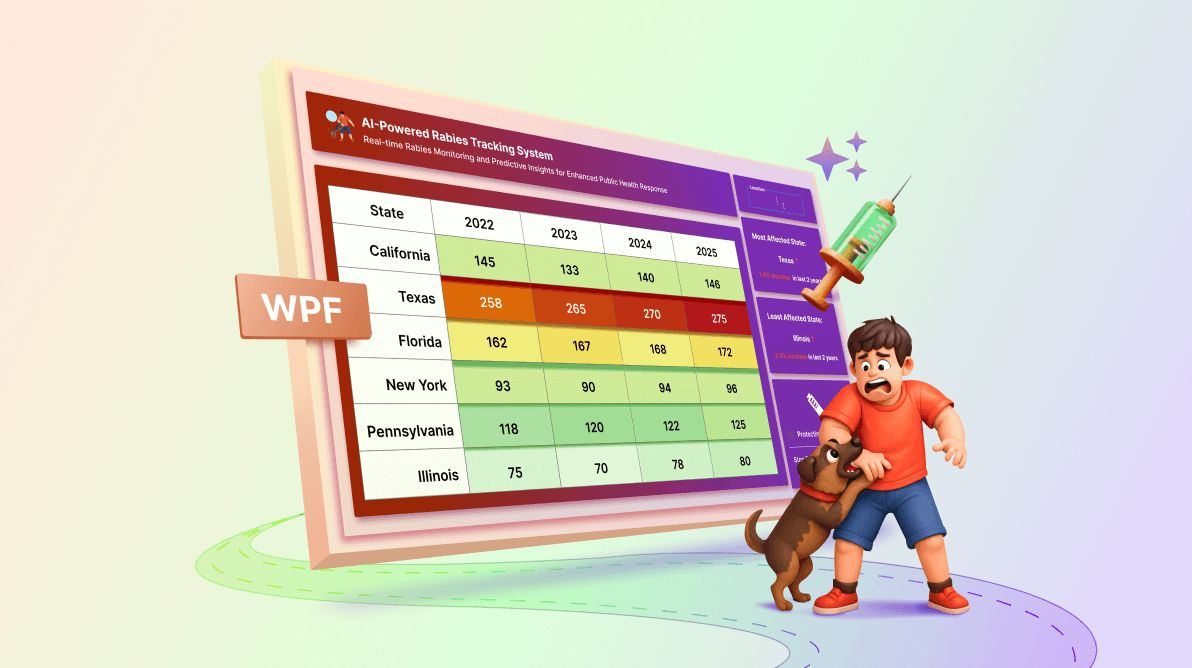
Rabies remains a critical yet fully preventable disease in many regions, especially where health‑reporting systems remain slow or fragmented. Public health teams need quick visibility into where cases are rising, which states face higher risk, and how patterns shift over time. A heatmap makes that easy to see at a glance, and AI makes it even faster.
In this guide, you’ll build an AI-powered heatmap chart in WPF that automatically highlights critical areas using the Syncfusion® WPF Heatmap Chart and an Azure OpenAI–driven data workflow.
Why build an AI-Assisted Heatmap for rabies monitoring?
Manual disease‑tracking systems slow down decision-making. Rabies is a strong example: it’s preventable, yet outbreaks persist due to late reporting and fragmented data sources.
Developers can solve that problem with AI-enhanced visualization. By combining Azure OpenAI + Syncfusion SfHeatMap, you get:
- Real-time case visualization with a color-coded heatmap chart for instant identification of affected regions.
- Automatic critical area highlighting of the most and least affected states.
- AI-based pattern analysis across multiple years (2018-2025).
- Insights such as percentage change trends.
- Smooth integration with public health datasets.
This approach works for any domain that requires critical zone detection, finance, operations, health, IoT, or logistics.
How does the dashboard work?
You’ll implement a flow where:
- User searches for a location (country or region).
- AI retrieves 8 years of historical rabies case data.
- The app processes the JSON payload, organizing data by year and state.
- The WPF Heatmap Chart visualizes the data with auto-applied gradients (red for higher cases, green for lower cases). Display key metrics like “Most Affected State” and “Least Affected State” with trend indicators.
- AI calculates key insights, such as drastic increases or improvements for the past 2 years. Identify critical trends (increases or decreases) and provide actionable insights.
Let’s walk through building this system step‑by‑step.
Step 1: Populating the data using the AI service
We’ll use an AI-powered API to fetch rabies case data for different Country/regions. First, define the RabiesDataInfo model class, which holds properties for rabies case details across different states and years.
public class RabisTrackerInfo
{
    // Holds yearly rabies tracker metrics for each state.
}
Next, implement the RabiesTrackerService class, which is the core of this dashboard. This class handles credential validation, prompt generation, and AI-based responses.
Refer to the following code example.
public class RabiesTrackerService
{
    // Handles AI requests and transforms responses into strongly typed data.
}
Finally, create the RabiesTrackingViewModel class to store the retrieved data and serve as the dashboard’s binding context. This ViewModel manages the data flow between the AI service and the UI controls.
Refer to the following example code.
public class RabisTrackerViewModel : INotifyPropertyChanged
{
   // ViewModel for binding data between AI service and UI.
}
Step 2: Configure the layout
A clean layout improves readability, especially when displaying multiple years of data.
Your layout includes:
- Header panel: Title, subtitle, and location input.
- Heatmap visualization: Large, central panel.
- Insight panels: Most and least affected states.
- Awareness panel: Supportive public‑health messaging.
A simplified version of the grid structure:
<!--MainGrid-->
<Grid>

    <Grid.RowDefinitions>
        <RowDefinition Height="1.5*"/>
        <RowDefinition Height="2.5*"/>
        <RowDefinition Height="2.5*"/>
        <RowDefinition Height="3.5*"/>
    </Grid.RowDefinitions>

    <Grid.ColumnDefinitions>
        <ColumnDefinition Width="8*"/>
        <ColumnDefinition Width="2*"/>
    </Grid.ColumnDefinitions>

    <!--Title-->
    <Border Grid.Row="0" Grid.Column="0" >
              …
   </Border>

   <!-- Input box for enter location -->
   <Border Grid.Row="0" Grid.Column="1">
              …
   </Border>

   <!-- Heat Map Chart Visualization -->
   <Border Grid.Row="1" Grid.RowSpan="3" Grid.Column="0">
              …
   </Border>

   <!-- Most Affected Summary -->
   <Border Grid.Row="1" Grid.Column="1" >
             …
   </Border>

   <!-- Least Affected Summary -->
   <Border Grid.Row="2" Grid.Column="1">
        …
   </Border>

   <!-- Awareness Panel -->
   <Border Grid.Row="3" Grid.Column="1">
        …
   </Border>
</Grid>
Step 2.1: Implement header panel
After setting up the layout, add a clear title, a subtle logo, and a concise subtitle to establish the analytical context.
The WPF Text Input Layout is used to enter the location where rabies case details are to be retrieved. This control enables dynamic data retrieval based on the selected location.
Here’s how you can do it in code:
<Border Grid.Row="0" Grid.Column="0" Margin="10" Padding="5" CornerRadius="10" Background="#2b1b37" >
         <Grid>
             <Grid.ColumnDefinitions>
                 <ColumnDefinition Width="0.5*"/>
                 <ColumnDefinition Width="9.5*"/>
             </Grid.ColumnDefinitions>
             <Image Source="/Images/RabisImage.png" Height="70" Width="70" Grid.Column="0"/>

             <StackPanel Margin="10" Grid.Column="1">
                 <TextBlock Text="AI-Powered Rabis Tracking System" FontSize="26" FontWeight="Bold" Foreground="#f9f7fc"/>
                 <TextBlock Text=" Real-time Rabies Monitoring and Predictive Insights for Enhanced Public Health Response" Margin="0,4" Foreground="#f9f7fc" FontSize="18" FontWeight="Bold"/>
             </StackPanel>
         </Grid>
     </Border>

     <Border Grid.Row="0" Grid.Column="1" Margin="10" Padding="5" CornerRadius="10" Background="#2b1b37">
         <inputLayout:SfTextInputLayout Grid.RowSpan="2" Grid.Column="2" Hint="Location"  ContainerType="Outlined" IsEnabled="{Binding IsEnabled}" FontSize="17" VerticalContentAlignment="Center"
                                        HorizontalContentAlignment="Center" Width="200" Margin="8" Foreground="#f9f7fc" FontWeight="Bold" BorderBrush="#6d4e89" FocusedForeground="#f9f7fc" >
             <TextBox x:Name="countryTextBox" Text="{Binding CountryName}" KeyDown="TextBox_KeyDown" TextWrapping="Wrap" HorizontalContentAlignment="Center" Foreground="#f9f7fc" CaretBrush="#f9f7fc"/>
         </inputLayout:SfTextInputLayout>
     </Border>
    </Grid>
private async void TextBox_KeyDown(object sender, KeyEventArgs e)
{
   // Handles user input, resets view model state, and refreshes rabies case data
}
Here’s what the header looks like:

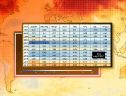
Step 2.2: Configure the WPF Heatmap Chart
Next, configure the WPF Heatmap Chart control and then bind the rabies case data returned by the AI service.
<syncfusion:SfHeatMap ItemsSource="{Binding CaseData}"
                      HorizontalAlignment="Center"
                      VerticalAlignment="Center"
                      ItemsMapping="{StaticResource itemsMapping}"
                      ColorMappingCollection="{Binding ColorMappingData}">
 </syncfusion:SfHeatMap>
Below are the key configuration elements:
Table mapping setup: Define the mapping between the data model and the heatmap display structure, as shown in the code example below.
<syncfusion:TableMapping x:Key="itemsMapping">
    <syncfusion:TableMapping.HeaderMapping>
        <syncfusion:ColumnMapping PropertyName="State" DisplayName="State"/>
    </syncfusion:TableMapping.HeaderMapping>

    <syncfusion:TableMapping.ColumnMapping>
        <syncfusion:ColumnMapping PropertyName="Y2018" DisplayName="2018"/>
        <syncfusion:ColumnMapping PropertyName="Y2019" DisplayName="2019"/>
<!--.....-->
    </syncfusion:TableMapping.ColumnMapping>
</syncfusion:TableMapping>
Cell styling: Customize the appearance of heatmap cells for better readability, as shown in the code example below.
<Style TargetType="syncfusion:HeatMapCell">
     <Setter Property="MinWidth" Value="130"/>
     <Setter Property="MinHeight" Value="50"/>
</Style>

<Style TargetType="syncfusion:ColumnHeader">
     <Setter Property="MinWidth" Value="100"/>
     <Setter Property="MinHeight" Value="40"/>
</Style>
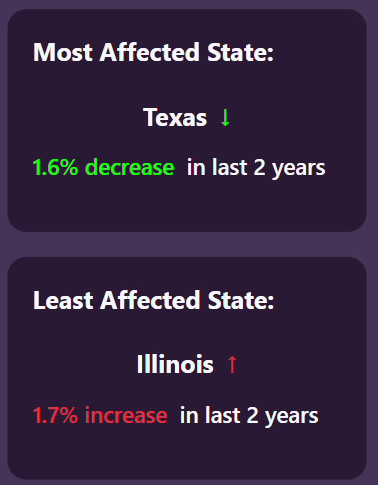
Step 2.3: Tracking rabies trends: Most vs. least impacted states
The dashboard includes intelligent summary sections that automatically identify and display the most and the least affected states based on AI-driven analysis of rabies case data. These summaries provide real-time trend indicators, highlighting percentage changes observed over the last two years. These insights help public‑health teams focus interventions and allocate resources more efficiently.
- Most affected state: Shows the state with the highest rabies cases and a color-coded trend indicator.
- Least affected state: Displays the state with the lowest rabies cases and a color-coded trend indicator.
Try this in your code:
<!-- Most Affected State -->
    <StackPanel Margin="20">
        <TextBlock Text="Most Affected State:" FontSize="20" Foreground="#f9f7fc" FontWeight="Bold" Margin="0,0,0,10"/>
        <StackPanel Orientation="Horizontal" HorizontalAlignment="Center" Margin="15">
            <TextBlock Text="{Binding MostAffectedState}" FontSize="20" FontWeight="Bold" Foreground="#f9f7fc" Margin="0,0,10,0"/>
            <TextBlock Text="{Binding MostAffectedTrendIndicator}" FontSize="20" FontWeight="Bold" Foreground="{Binding MostAffectedTrendColor}"/>
        </StackPanel>

        <TextBlock FontSize="18" FontWeight="SemiBold">
            <Run Text="{Binding MostAffectedPercentageChange}" Foreground="{Binding MostAffectedTrendColor}"/>
            <Run Text=" in last 2 years" Foreground="#f9f7fc"/>
        </TextBlock>
    </StackPanel>

    <!-- Least Affected State -->
    <StackPanel Margin="20">
        <TextBlock Text="Least Affected State:" FontSize="20" Foreground="#f9f7fc" FontWeight="Bold" Margin="0,0,0,10"/>
        <StackPanel Orientation="Horizontal" HorizontalAlignment="Center" Margin="15">
            <TextBlock Text="{Binding LeastAffectedState}" FontSize="20" FontWeight="Bold" Foreground="#f9f7fc" Margin="0,0,10,0"/>
            <TextBlock Text="{Binding LeastAffectedTrendIndicator}" FontSize="20" FontWeight="Bold" Foreground="{Binding LeastAffectedTrendColor}"/>
        </StackPanel>

        <TextBlock FontSize="18" FontWeight="SemiBold" >
            <Run Text="{Binding LeastAffectedPercentageChange}" Foreground="{Binding LeastAffectedTrendColor}" FontWeight="SemiBold"/>
            <Run Text=" in last 2 years" Foreground="#f9f7fc"/>
        </TextBlock>
    </StackPanel>
Here’s how summary sections look.
Step 3: Adding the WPF busy indicator for better visualization
Let’s add a WPF Busy Indicator to enhance the user experience while fetching data, ensuring smooth and responsive UI interactions.
<Notification:SfBusyIndicator
    Grid.Row="2"
    x:Name="busyIndicator"
    HorizontalAlignment="Center"
    VerticalAlignment="Center"
    IsBusy="{Binding IsBusy}"
    AnimationType="Flower"
    Background="Transparent"/>
Refer to the following image.
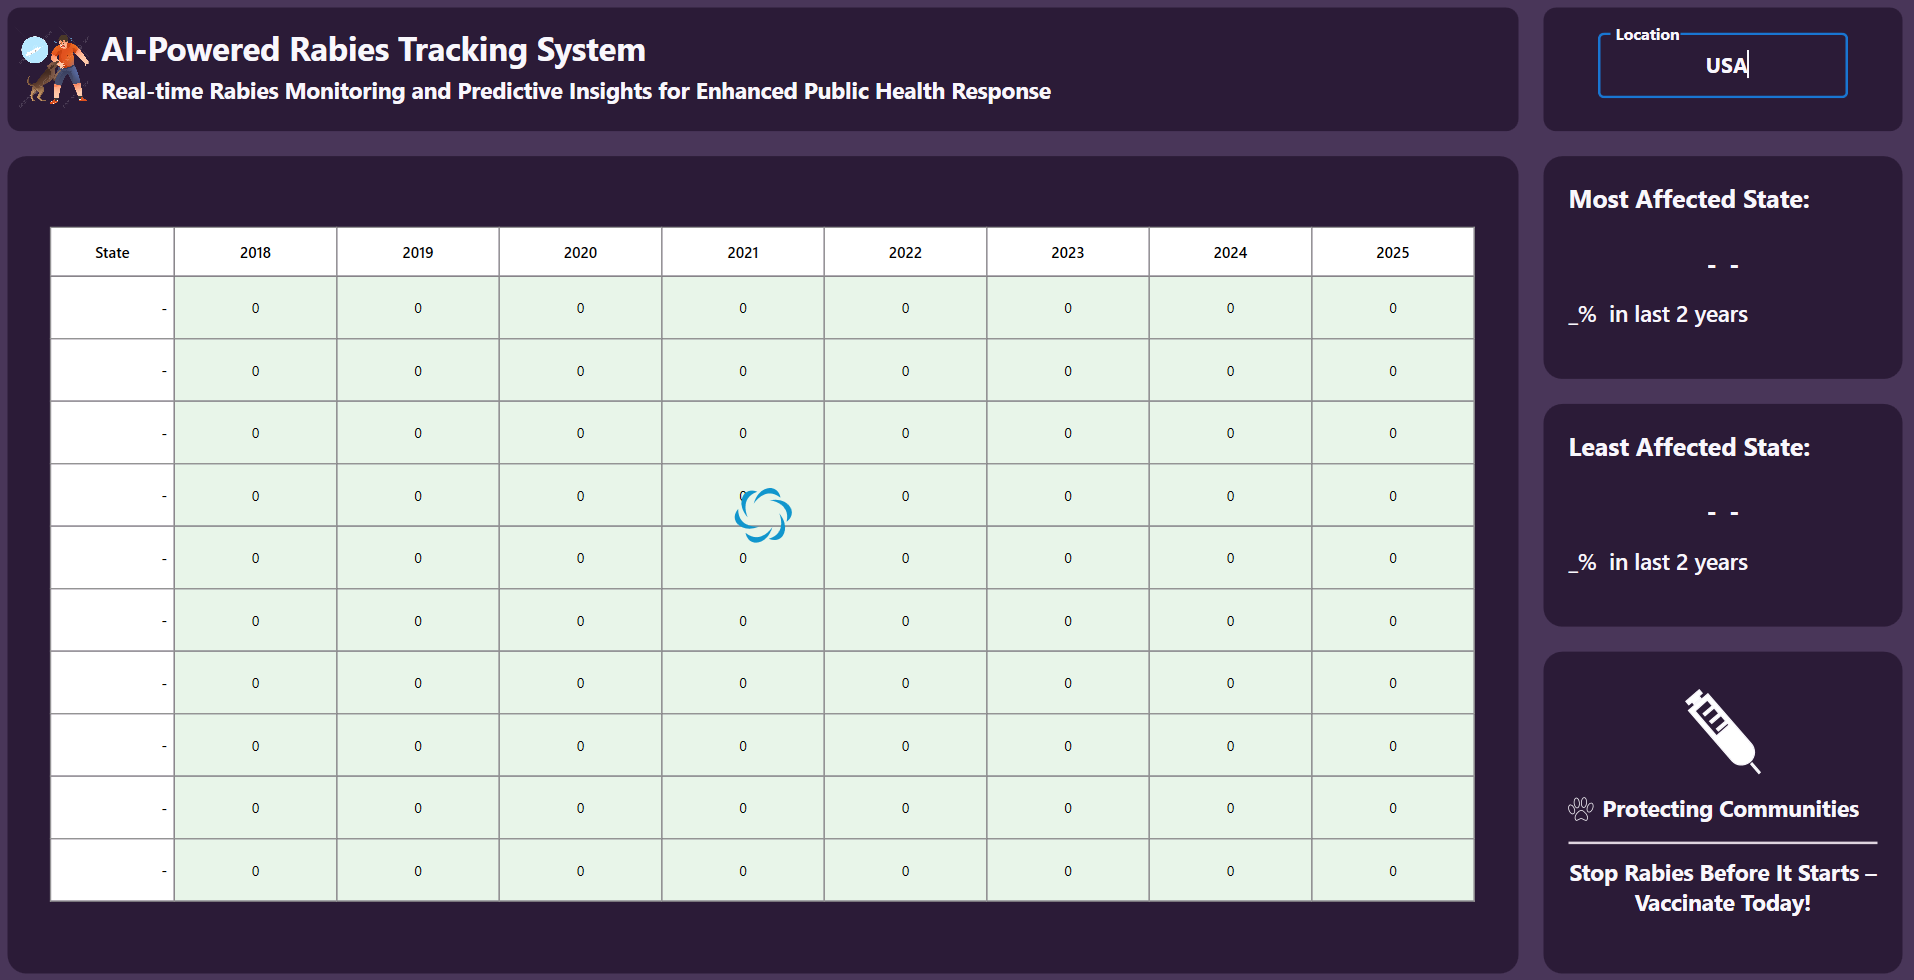
After running the previous code examples, the dashboard will look like the demo video below.
GitHub reference
For more details, refer to the AI-assisted WPF Heatmap Chart GitHub sample.
Frequently Asked Questions
Use the `LegendMode` property to switch between Gradient or List modes for the HeatMap chart.How do I customize the Legend mode of the HeatMap Chart?
Data can be mapped to the HeatMap Chart using the `ItemsMapping` property. It supports both How do I map the datasource with the HeatMap Chart?
TableMapping and CellMapping.
You can highlight critical or important value ranges using How do I automatically highlight critical areas in the SfHeatMap Chart?
ColorMapping, where each range is assigned a specific color, such as red for critical.
Use the How do I customize the Legend orientation of the Heatmap Chart?
`Orientation` property to adjust the legend orientation in the HeatMap chart.
Users can enter a country or region (e.g., India) and instantly view a HeatMap chart filtered based on that location’s data.How is location-based filtering used in the interface?
Conclusion
Thanks for reading! This blog explored how to build an AI-Assisted Heatmap Chart using the Syncfusion WPF Heatmap Chart control. Follow the outlined steps and share your feedback in the comments.
If you’re a Syncfusion user, you can download the setup from the license and downloads page. Otherwise, you can download a free 30-day trial.
You can also contact us through our support forum, support portal, or feedback portal for queries. We are always happy to assist you!


 No spam, just valuable updates.