
WPF Debugging and Performance Succinctly®

CHAPTER 5
XAML Debugging
Without a doubt, the most important part of the WPF development platform is the user interface. With WPF, you can create powerful, beautiful, and dynamic applications with a modern user interface. While designing, developing, and testing your apps’ user interface, you might need to inspect the behavior of controls, styles, and templates at runtime, or you might need to discover subtle bugs, especially with data-binding. Before Visual Studio 2015, every time you needed to make an edit to your XAML, you had to break the application execution. Investigating the visual tree at runtime was impossible unless you used external tools. Because investigating XAML and the visual tree at runtime can be very important, Microsoft improved the debugging experience in Visual Studio 2015, offering tools that make it easier to understand if the UI is behaving as expected and also easier to make changes while the app is running.
Note: This chapter requires at least Visual Studio 2015 Update 2. As of writing this, Microsoft has released Update 3, which you can download at https://go.microsoft.com/fwlink/?LinkId=691129.
WPF Trace
WPF Trace is a very useful but often forgotten tool. At debugging time, WPF Trace sends diagnostic information to the Output window based on varying verbosity levels. For example, if your XAML has invalid data-bindings, these are reported in the Output window, which makes investigating (and solving) problems easier. WPF Trace is not limited to XAML and data-binding; it actually includes some tracing scenarios related to XAML, but it offers more. WPF Trace can be enabled by selecting Tools, Options, Debugging, Output Window, then scrolling to the WPF Trace Settings section, as you can see in Figure 27.
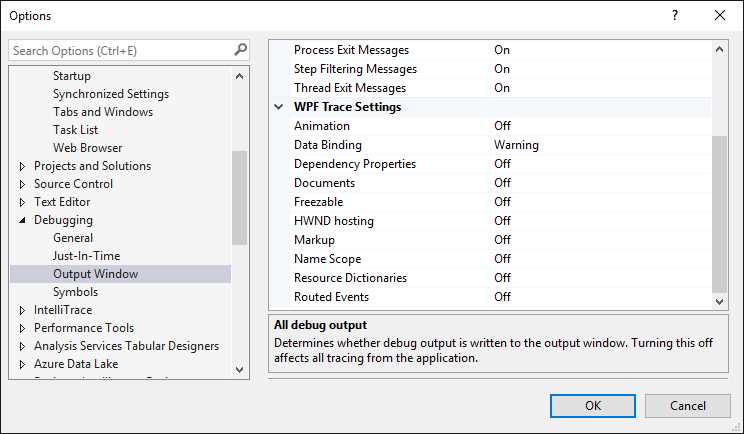
Figure 27: Displaying WPF Trace Settings
By default, tracing is disabled for all scenarios except for Data Binding, whose default level is Warning. This means that warning messages will be shown in the Output window if data-binding is not working properly. To understand how tracing works, let’s consider an invalid data-binding, which is probably the most common situation for using the tool. Suppose, for example, you have the ListBox control shown in Code Listing 8, which is used to display a list of active processes on your machine.
Code Listing 8
<ListBox Name="FileListBox" ItemsSource="{Binding}"> <ListBox.ItemTemplate> <DataTemplate> <!-- Binding target name is intentionally wrong --> <TextBlock Text="{Binding ProcesName}"/> </DataTemplate> </ListBox.ItemTemplate> </ListBox> |
As you can see, the binding target name is wrong (which is intentional for demonstration purposes); in fact, it should be ProcessName, not ProcesName. The data source for the ListBox could be assigned as follows:
FileListBox.ItemsSource = System.Diagnostics.Process.GetProcesses().AsEnumerable();
When you run this code, the Output window will show a warning message (see Figure 28) explaining that there is a data-binding error because a property called ProcesName was not found on the bound object called Process.

Figure 28: Displaying WPF Trace Settings
Tip: Scroll the Output window horizontally to see the full diagnostic message.
WPF Trace tells you that the supplied binding source (the property name) has not been found on the bound object (Process, in this case). This will help you detect and fix the problem immediately. You can get even more detailed information by changing the trace level from Warning to Verbose.
Note: You might expect that setting the trace level to Error would break the application execution. Actually, setting the trace level to Error will only change the way the diagnostic information is presented—it will not break the execution.
Though WPF Trace can be used in a number of scenarios, without a doubt it is particularly useful with invalid data-binding and animation bindings.
UI debugging tools
Visual Studio 2015 has dramatically improved the debugging experience for WPF (and Universal Windows Platform, as well) by introducing a number of tools that make it easy to investigate and change the behavior of the user interface at runtime. This section describes new tool windows introduced with Visual Studio 2015, Live Visual Tree and Live Property Explorer, and the In-App Menu, available with Visual Studio 2015 Update 2 and higher.
Live Visual Tree and Live Property Explorer
Note: In order to fully discuss the UI debugging tools, make sure you go to Tools, Options, Debugging, then select an option called “Preview selected elements in Live Visual Tree.”
Visual Studio 2015 introduced two new tool windows to the WPF debugging experience: Live Visual Tree and Live Property Explorer. Live Visual Tree shows the full visual tree of the user interface; when you select an element in the visual tree view, Live Property Explorer shows the full list of property values for the selected item and allows changing property values at runtime (if supported), so that you can immediately see how the user interface changes. Both windows should be automatically visible when you begin debugging a WPF application. If not, you can pick them up from Debug, Windows. Figure 29 shows Live Visual Tree and Live Property Explorer over the SampleWpf application we previously created.
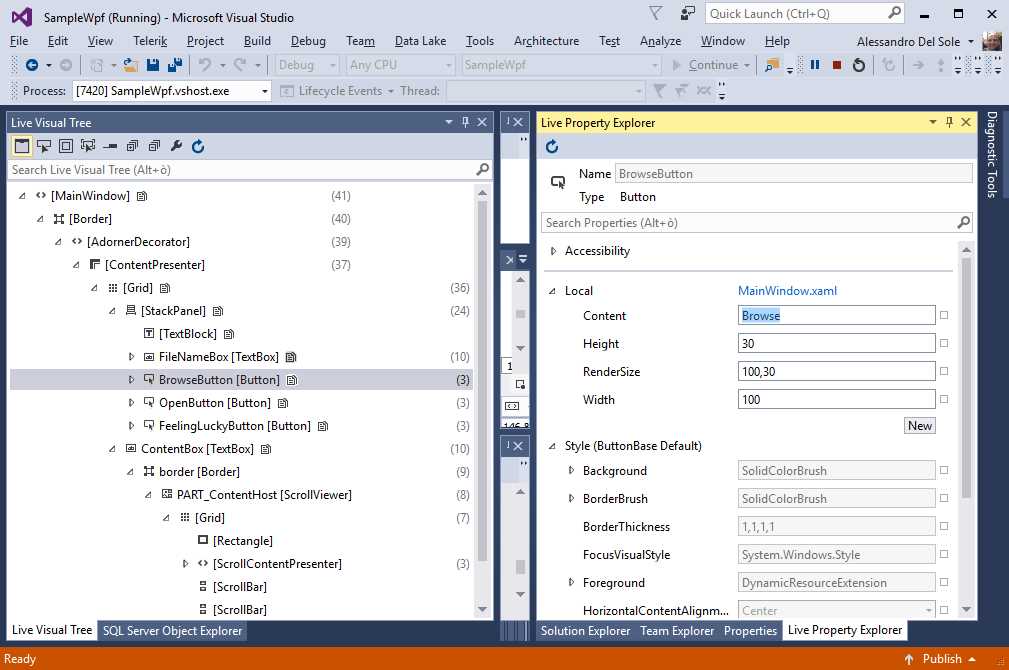
Figure 29: Live Visual Tree and Live Property Explorer
As you can see, selecting an item in the visual tree will cause Live Property Explorer to display properties and their values in that exact moment of the application lifecycle. Notice that some property values can be changed at runtime so that you can immediately see how the user interface reflects those changes. For instance, Figure 29 shows how you can change the value for the button’s Content property with a new string, and you will immediately see the new value in the user interface while running. When you select an element in the Live Visual Tree, the corresponding line of code is selected in the XAML editor (you can also achieve this by right-clicking the element, then selecting View Source). Before Visual Studio 2015 Update 2, interacting with Live Visual Tree and Live Property Explorer required you to move your focus from the active window to Visual Studio. As we’ll see in the next section, this situation has been improved.
XAML In-App Menu
Visual Studio 2015 Update 2 introduced the In-App Menu, a tool that makes it easier to inspect the behavior of your XAML at runtime. This tool consists of a pane that appears over a window at debugging time and provides a number of buttons that will be discussed shortly. Figure 30 shows the In-App Menu.
Tip: The In-App Menu is enabled by default in XAML-based platforms such as WPF and Universal Windows Platform. If you want to disable it, go to Tools, Options, Debugging, then unselect the “Show runtime tools in application” option.
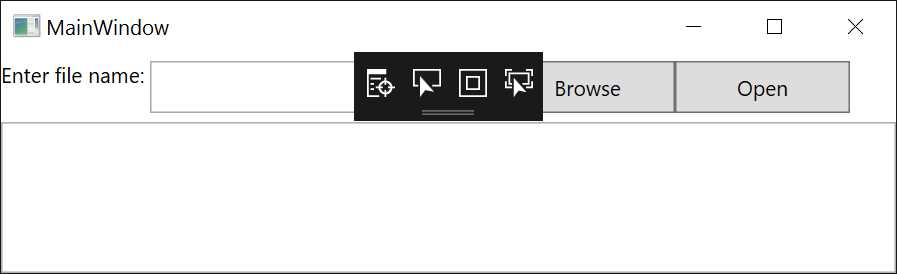
Figure 30: The In-App Menu Expanded
The In-App Menu can certainly be minimized, which helps us avoid overlaying parts of the UI, but for now leave it open. The menu has four buttons (described from left to right in the next paragraphs).
Go to Live Visual Tree
As the name implies, this button simply opens the Live Visual Tree tool window. I suggest you dock the Live Visual Tree window so that you will immediately see the result of the next buttons.
Enable Selection
This button allows you to select controls on the user interface. When you select a control, this is surrounded with a red border, and the Live Visual Tree window automatically shows the selected control within the visual tree. Figure 31 shows an example.
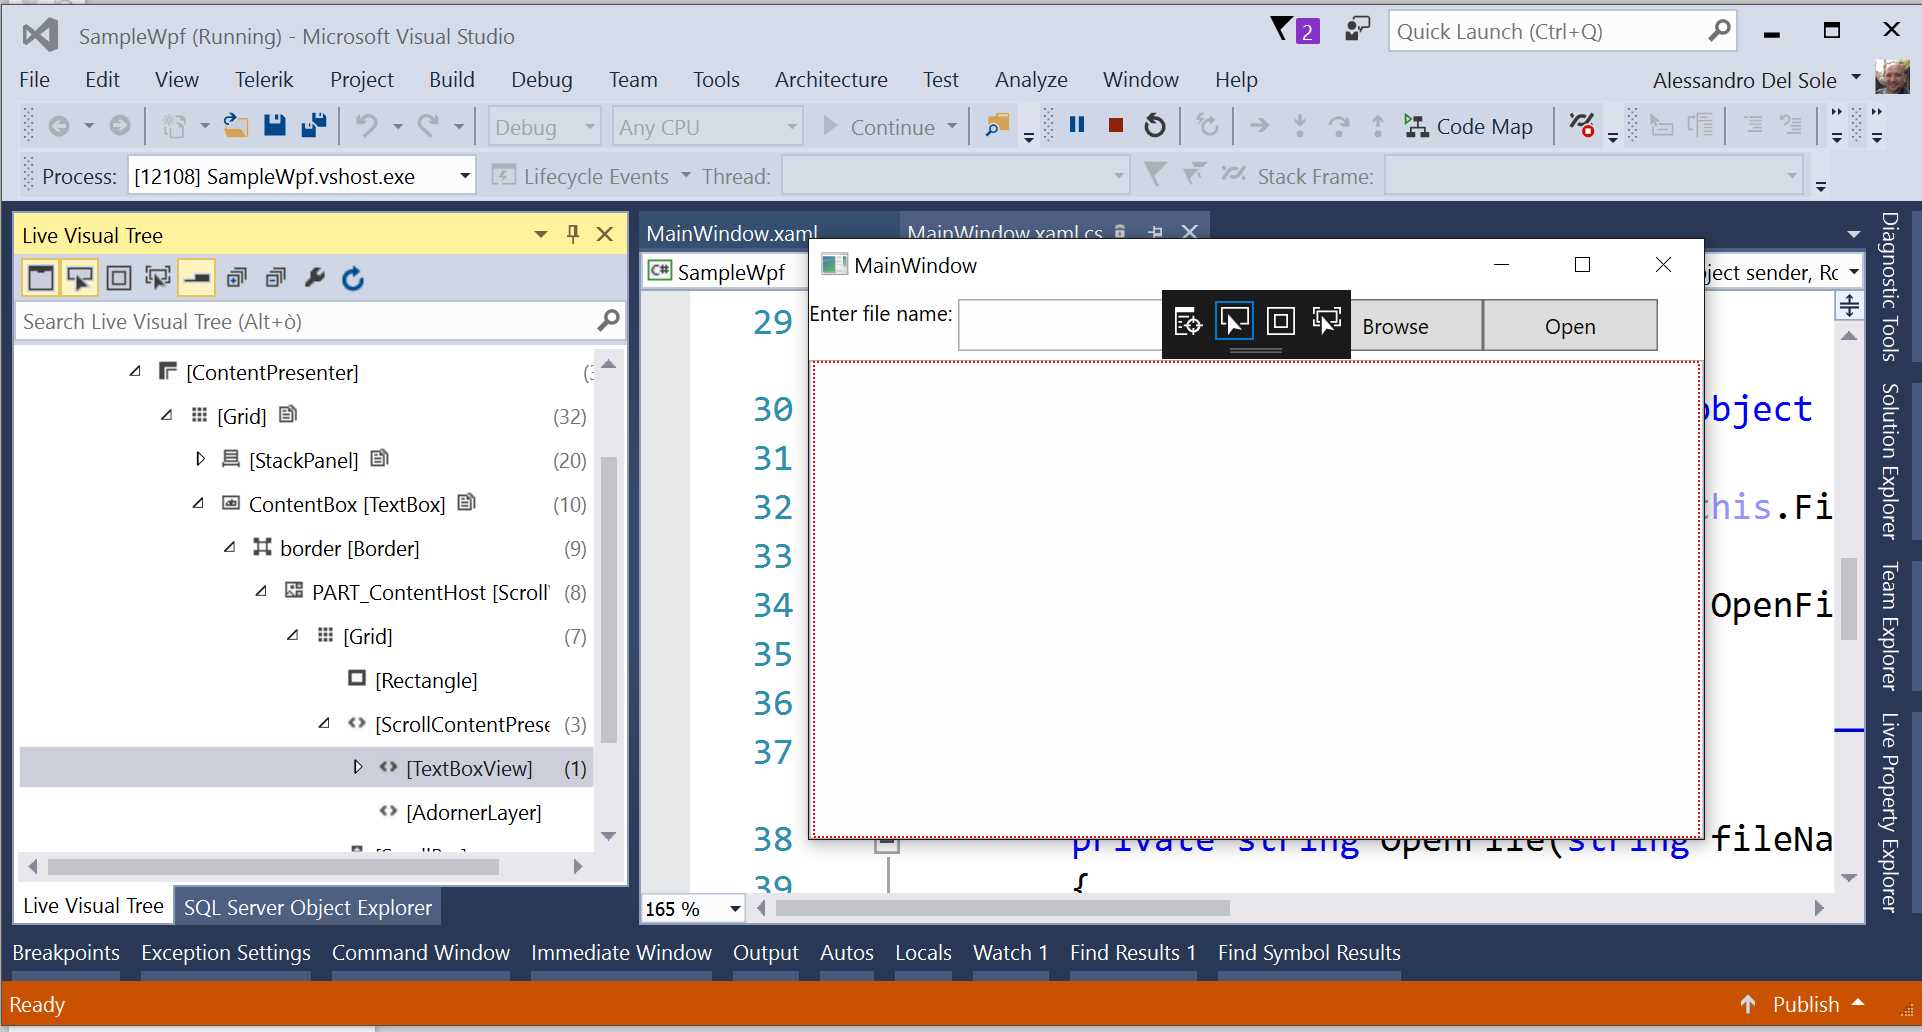
Figure 31: Enabling Selection in the In-App Menu
Display Layout Adornments
This button allows you to highlight the surface of a control. If combined with Enable Selection, a control is both highlighted and selected. This is useful for understanding the delimiters of a control. Figure 32 shows an example based on the combination of both buttons.
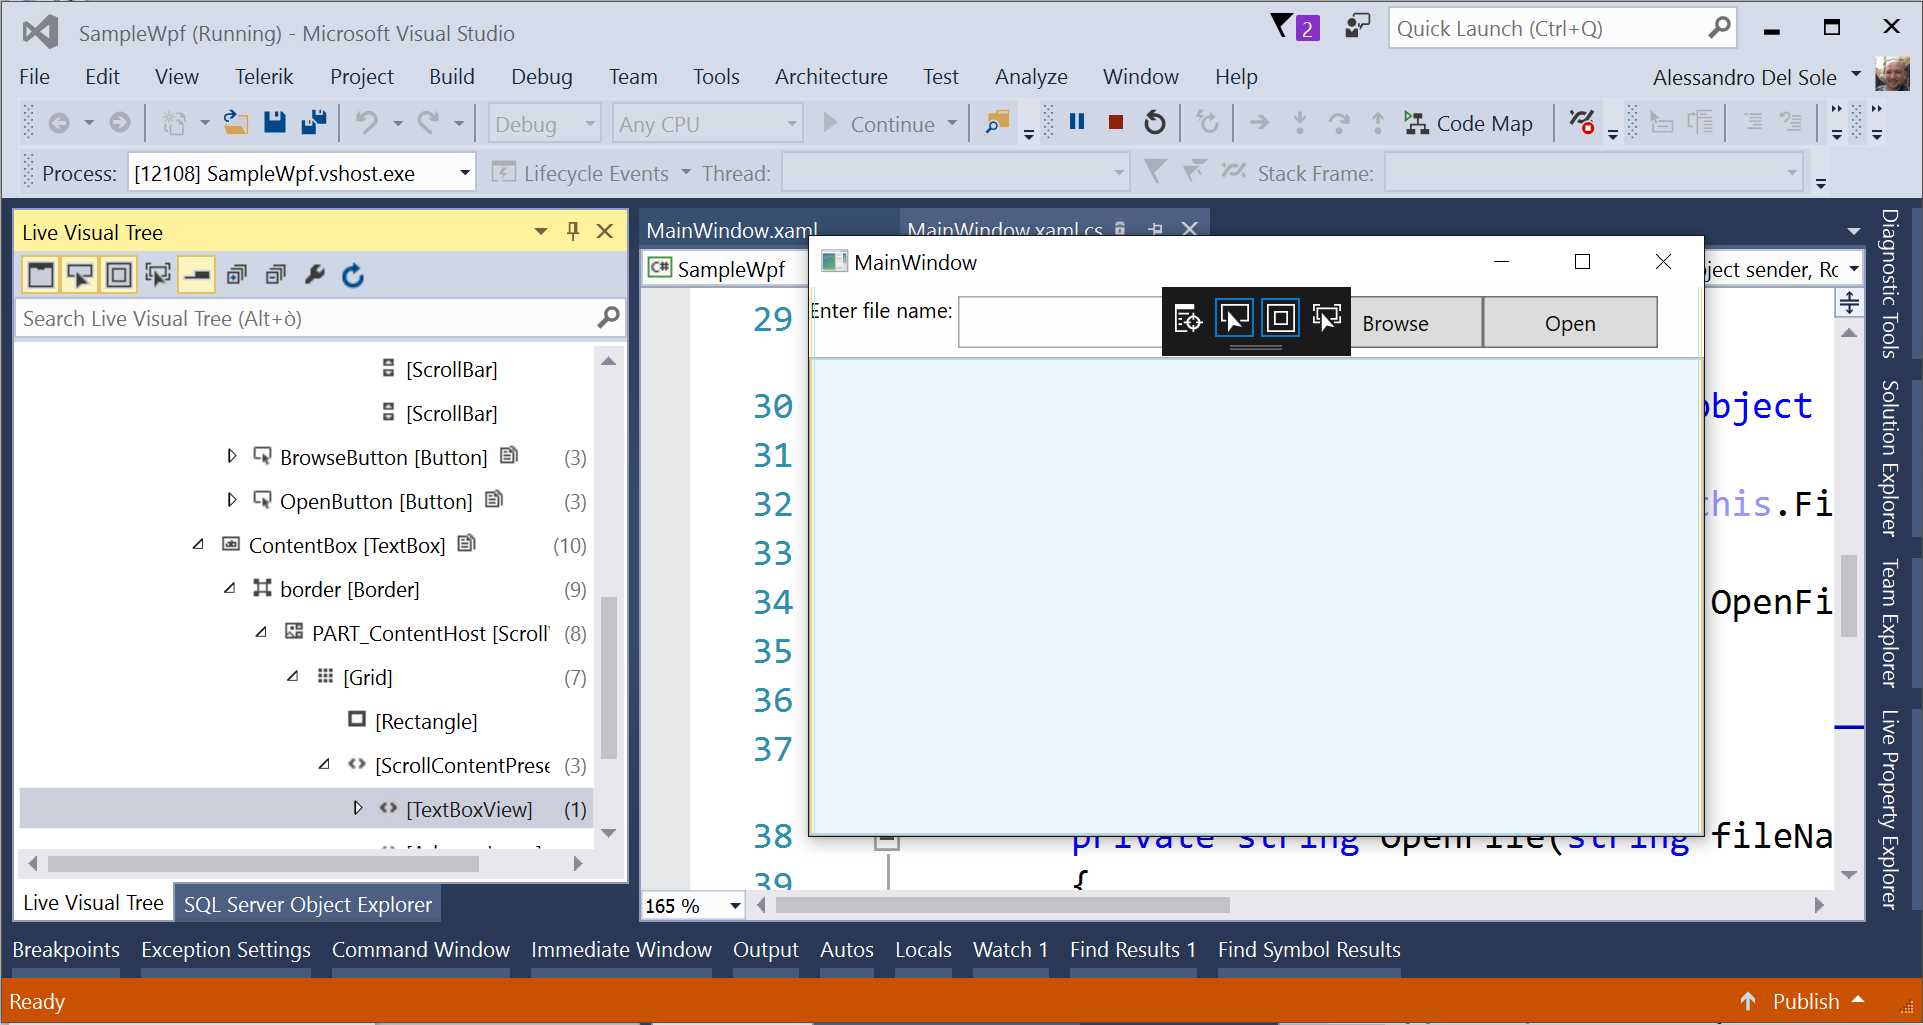
Figure 32: Displaying Layout Adornments
Track Focused Element
The Track Focused Element is similar to Enable Selection in that it allows selecting a control and reflects the selection in Live Visual Tree, but it only allows selecting controls that can receive focus (for instance, TextBox controls).
XAML Edit and Continue
The new release of Visual Studio includes a new feature known as XAML Edit and Continue. This feature allows editing some property values in your XAML at debugging time, with changes immediately reflected in the user interface of your application. For instance, you might want to see how changing a style or control template affects the user interface while running.
Chapter summary
With WPF, debugging means not only investigating code for bugs and checking for errors. It also means checking if the user interface is designed and behaves as expected, which involves analyzing controls and XAML at debugging time. Visual Studio 2015 and 2017 have specific tools that make this task a comfortable experience. With the WPF Trace tool, you can easily detect errors in your XAML code, especially for data-binding. The Live Visual Tree and Live Property Explorer tool windows represent the visual tree and change UI elements’ property values, where supported. An easier interaction with both windows is possible through the new In-App Menu, which provides buttons that easily map controls to XAML code and to visual tree elements.
- 100+ essential WPF UI controls like DataGrid, Charts, and Diagram.
- 10+ built-in themes, plus Theme Studio app for designing custom themes.
- Powerful document processing libraries for Excel, PDF, Word, and PowerPoint file formats.