
WPF Debugging and Performance Succinctly®

CHAPTER 4
Debugger Visualizers and Trace Listeners
Debugging not only means searching for and fixing errors, it also means collecting diagnostic information that helps developers understand how the application behaves at specific points during its lifetime. This is even more important in WPF applications because they can work with a large range of resources, such as graphics, media, and data. This chapter will explain how to collect information using debugger visualizers and trace listeners.
Introducing debugger visualizers
In some situations, you might have objects, controls, or variables that store data in a particular format. For example, you might have a string representing XML or JSON data. While debugging, you might need a way to investigate this kind of information with an appropriate view. Visual Studio makes this possible with debugger visualizers. For a better understanding, in the sample application place a breakpoint on the following line, which is located in the OpenButton_Click event handler:
this.ContentBox.Text = fileContent;
When the breakpoint is hit, if you hover over the fileContent variable you will see a data tip that shows the variable’s value. The data tip also provides a small magnifying glass icon that you can click to pick one of the available visualizers (see Figure 22).
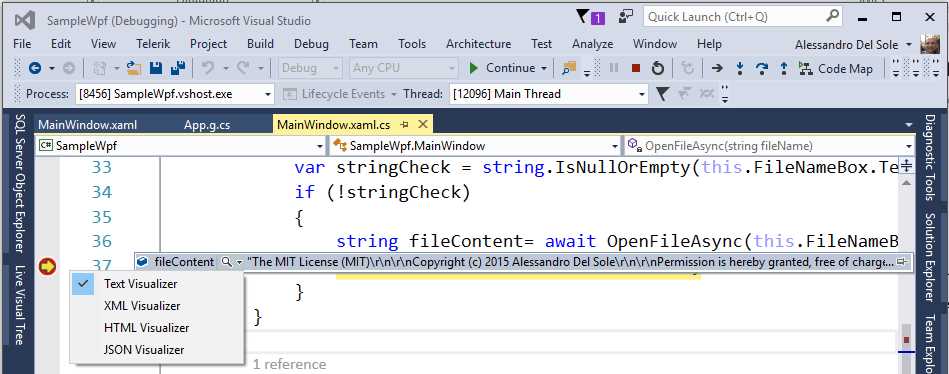
Figure 22: Selecting a Debugger Visualizer
Depending on the format of your information, you can pick the most appropriate visualizer. In this case, the string contains plain text, which means that selecting the Text Visualizer is the proper choice. Figure 23 shows the Text Visualizer in action.
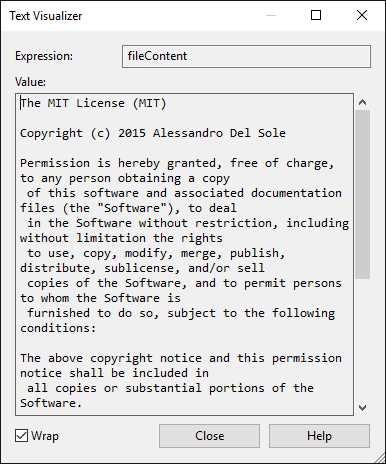
Figure 23: Text Visualizer Allows Viewing Plain Text
Now suppose your variable contains XML data. You could select the XML Visualizer to get a structured view of your file instead of plain text. Figure 24 shows an example.
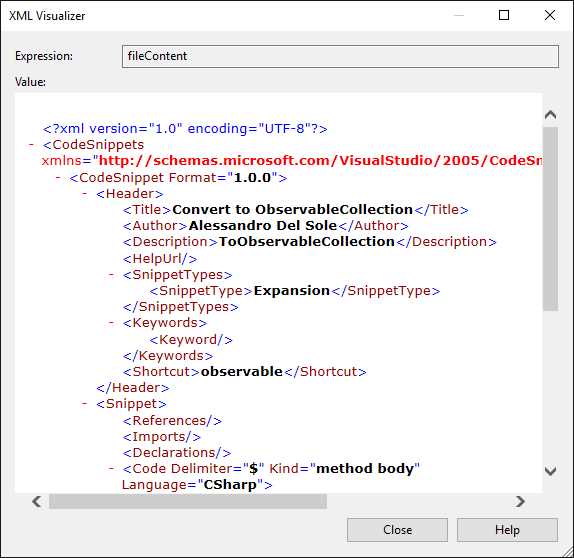
Figure 24: XML Visualizer Allows Viewing Structured XML Contents
As with the XML Visualizer, the JSON and HTML Visualizers help you investigate formatted contents. Debugger visualizers are very useful, especially when you have long and complex information you need to view and the data tips are not enough.
The WPF Tree Visualizer
WPF has a special debugger visualizer called WPF Tree Visualizer, which allows you to inspect values of controls’ properties at runtime.
Note: This visualizer is discussed for consistency with the WPF platform, but you might prefer the Live Property Explorer and Live Visual Tree windows described in Chapter 5 XAML Debugging.
This visualizer’s goal is to provide a hierarchical view of the visual tree of the current window or user control. You enable it by hovering over a control’s name in the code editor while in break mode, then clicking the magnifier icon that appears on the data tip. Figure 25 shows an example based on the FileNameBox control in the sample application.
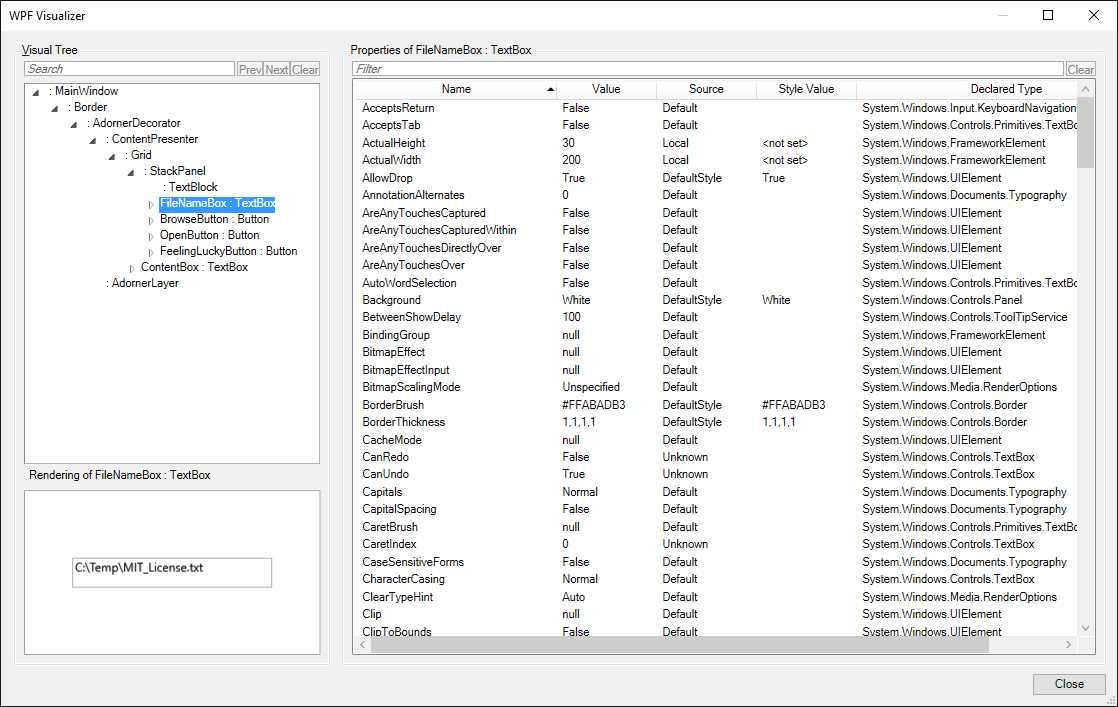
Figure 25: WPF Tree Visualizer Showing a Control’s Property Values
As you can see in Figure 25, the left side the WPF Tree Visualizer shows the visual tree of the user interface and a preview of how the selected control is rendered at runtime. On the right side, the tool shows the full list of properties for the selected control and their values. You can also filter the property list using the text box at the top of the window. The WPF Tree Visualizer does not allow you to change property values at runtime, but in Chapter 5 you will discover how to accomplish this with more flexible tools.
Interaction with the debugger: the Debug and Trace classes
There are situations in which you do not need (or you do not want) to step through the code in break mode in order to understand what’s happening with your application during the execution, yet you will still need to retrieve some information—for example, a variable’s value. Visual Studio and the .NET Framework provide the Debug and Trace classes, both from the System.Diagnostics namespace, that allow interacting with the debugger in managed code and that also allow you to show information in the Output window. These classes are essentially identical, which means you can use them interchangeably, and both are static, exposing only static members. They evaluate conditions at a certain point of your code, then they can display contents in the Output window. For example, if you place the following line at the end of the OpenFileAsync method described in the previous chapter, you will see the content of the resulting string in the Output window:
System.Diagnostics.Debug.WriteLine(result);
Table 2 shows the list of methods exposed by Debug and Trace classes.
Table 2: Methods Exposed by Debug and Trace Classes
Assert | Evaluates a condition and shows a message if it is false. |
Fail | Shows an error message. |
Indent | Increases text indentation when writing to the Output window. |
Prints the specified message with support for formatting. | |
Unindent | Decreases indentation when writing to the Output window. |
Write | Writes the specified message without a line terminator. |
WriteIf | Writes the specified message without a line terminator if the specified condition is true. |
WriteLine | Writes the specified message with a line terminator. |
WriteLineIf | Writes the specified message with a line terminator if the specified condition is true. |
Actually, Debug and Trace not only allow writing diagnostic information to the Output window, but they also allow redirecting output from the debugger to the so-called trace listeners, which are described in the next section. In this case, both classes also offer the Close and Flush methods that empty the debugger’s buffer immediately and cause data to be written to the underlying listeners.
Controlling trace information
By default, when you build a project with the Debug configuration, the output of both Debug and Trace classes is included in the build output. This happens because the Debug configuration defines two constants, DEBUG and TRACE, which influence what output must be included. In order to change this behavior, you need to open the project’s Properties window, select the Build tab, and change the selection for the Define DEBUG Constant and Define TRACE Constant options. Figure 26 shows where these options can be found.
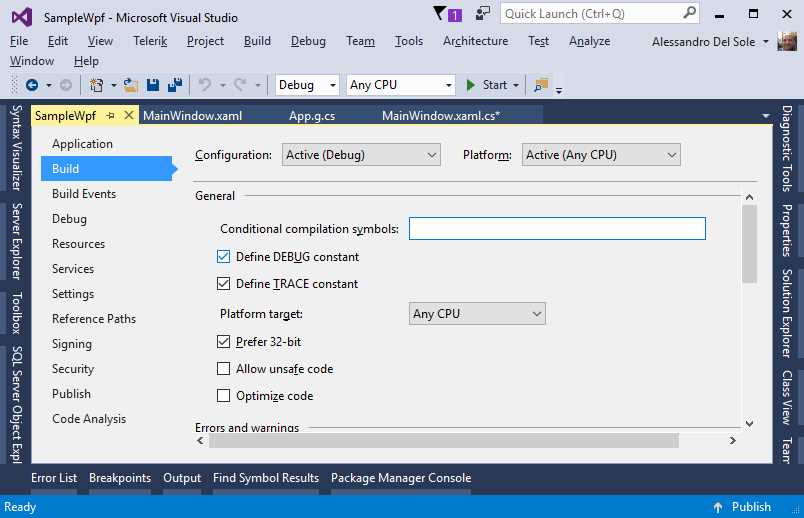
Figure 26: Controlling Whether DEBUG and TRACE Constants Should Be Defined
The Release configuration automatically includes the TRACE constant definition.
Exporting debugger information with trace listeners
By default, the Debug and Trace classes allow us to send information to the Output window. Actually, the Output window is one of the so-called trace listeners, special objects that can listen to the debugger and collect information in various forms. This means that you are not limited to sending information to the Output window. In fact, you can collect debugger information in the form of text files, XML files, and more. Both classes expose a Listeners property that can contain one or more built-in listeners. For example, the code shown in Code Listing 6 will redirect the debugger output to a text file instead of the Output window. This is accomplished by instantiating a listener called TextWriterTraceListener.
Code Listing 6
Trace.Listeners.Clear(); // Remove any listener. // Redirect the output to a text file. Trace.Listeners.Add( new TextWriterTraceListener("Diagnostics.txt")); // Ensure the output file is closed when // the debugger shuts down. Trace.AutoFlush = true; // Write the message only if the specified condition is true. Trace.WriteLineIf(!string.IsNullOrEmpty(result), "Valid file"); |
Notice that listeners do not overwrite existing files, they append information. If you want a new file every time, you must first remove the previous file. Table 3 shows the list of available trace listeners in the .NET Framework.
Table 3: Built-in Trace Listeners in the .NET Framework
DefaultTraceListener | Sends the debugger output to the Output window. |
ConsoleTraceListener | Sends the debugger output to the Console window. |
DelimitedListTraceListener | Sends the debugger output to a text file with information delimited by a symbol. |
EventLogTraceListener | Sends the debugger output to the Windows OS events log (requires administrator privileges). |
EventSchemaTraceListener | Sends the debugger output to an XML file that will be generated on an XML schema formed on the supplied parameters. |
TextWriterTraceListener | Sends the debugger output to a text file. |
XmlWriterTraceListener | Sends the debugger output to an XML file. |
Each listener is used in similar fashion, and, as usual, IntelliSense will help you pass the proper arguments to the constructor.
Working with trace listeners at configuration level
You are not limited to using trace listeners in C# or Visual Basic code. In fact, you can add listeners to a configuration file (App.config), which will make it easy to collect diagnostic information for a system administrator. Adding listeners to a configuration file must be done inside a node called system.diagnostics. For example, Code Listing 7 shows how to implement a trace listener that redirects the debugger output to a text file.
Code Listing 7
<?xml version="1.0" encoding="utf-8" ?> <configuration> <startup> <supportedRuntime version="v4.0" sku=".NETFramework,Version=v4.6.1" /> </startup> <system.diagnostics> <trace autoflush="true"> <listeners> <add name="DiagnosticTextWriter" type="System.Diagnostics.TextWriterTraceListener" initializeData="Diagnostics.txt"/> <!-- If you want to disable the DefaultTraceListener--> <remove name="Default"/> </listeners> </trace> </system.diagnostics> </configuration> |
You will be able to use other trace listeners in similar ways. If you do this in code instead of the configuration file, you will have more control over these objects. Further information about trace and debug settings in the configuration file can be found in the MSDN documentation.
Chapter summary
Visual Studio offers additional useful tools for investigating objects and values. With debugger visualizers, you have an option to visualize objects and members that are supplied in particular formats, such as text, XML, or JSON. With WPF, the WPF Tree Visualizer allows you to inspect the visual tree for a window or user control at runtime and examine its property values. If you do not need to break the execution and inspect an object’s value in break mode, you can also leverage the Debug and Trace classes to send the evaluation of an expression or an object’s value to the Output window. Sometimes you do not want to send information to the Output window, so you can work with trace listeners and redirect the debugger output to text files, XML files, or the Windows’ event log.
- 100+ essential WPF UI controls like DataGrid, Charts, and Diagram.
- 10+ built-in themes, plus Theme Studio app for designing custom themes.
- Powerful document processing libraries for Excel, PDF, Word, and PowerPoint file formats.