
WPF Debugging and Performance Succinctly®

CHAPTER 6
Analyzing the UI Performances
WPF has support for multimedia, animations, and documents. It also provides a very powerful data-binding engine with built-in virtualization for long lists of data. If your application works with hundreds of UI elements, including animations, multimedia, and data-bound controls, you must be aware of possible performance issues. The UI might slow down, and perceived performances might become tedious. Fortunately, Visual Studio has an interesting tool called Application Timeline that allows you to analyze the user interface performances, thereby making it easier to improve the user experience.
Preparing an example
Our previous sample application is very simple, and its user interface cannot have significant performance issues. For this reason, it’s a good idea to prepare a window that does more intensive work. First, in Solution Explorer, right-click the project name and select Add, Window. When the Add New Item dialog appears, enter ImageRenderingWindow.xaml as the name. This window’s goal is to display 1000 images inside a ListBox in order to analyze how the WPF rendering engine works. You need only this control with a simple data template that shows the image and its file name. Code Listing 9 shows the full XAML for the new window.
Code Listing 9
<Window x:Class="SampleWpf.ImageRenderingWindow" xmlns="http://schemas.microsoft.com/winfx/2006/xaml/presentation" xmlns:x="http://schemas.microsoft.com/winfx/2006/xaml" xmlns:d="http://schemas.microsoft.com/expression/blend/2008" xmlns:mc="http://schemas.openxmlformats.org/markup- compatibility/2006" xmlns:local="clr-namespace:SampleWpf" mc:Ignorable="d" Title="ImageRenderingWindow" Height="300" Width="300"> <Grid> <ListBox Name="ImageListBox" ItemsSource="{Binding}"> <ListBox.ItemTemplate> <DataTemplate> <StackPanel Orientation="Vertical"> <Image Width="320" Height="240" Source="{Binding ImagePath}"/> <TextBlock Text="{Binding ImageName}" /> </StackPanel> </DataTemplate> </ListBox.ItemTemplate> </ListBox> </Grid> </Window> |
The data template for the ListBox expects a class with two properties—one for the image path and one for the image file name. The class is called ImageFile and is defined in Code Listing 10 together with a collection called ImageFileCollection.
Code Listing 10
public class ImageFile { public Uri ImagePath { get; set; } public string ImageName { get; set; } } public class ImageFileCollection: ObservableCollection<ImageFile> { public ImageFileCollection() { for (int i=0; i <= 1000; i++) { // Replace with a file you have on your pc. this.Add(new ImageFile { ImageName="Beach.jpg", ImagePath = new Uri("Beach.jpg",UriKind.Relative) }); } } } |
For demonstration purposes only, the ImageFileCollection class is populated with 1000 instances of the same image in order to cause some overhead. Now make the new window the startup object for the application by editing the StartupUri attribute of the Application node in the App.xaml file as follows:
StartupUri="ImageRenderingWindow.xaml"
Next, edit the new Window’s constructor as shown in Code Listing 11 in order to assign a new ImageFileCollection as the data source.
Code Listing 11
public ImageRenderingWindow() { InitializeComponent(); this.DataContext = new ImageFileCollection(); } |
When ready, launch the application. It should look like in Figure 33.
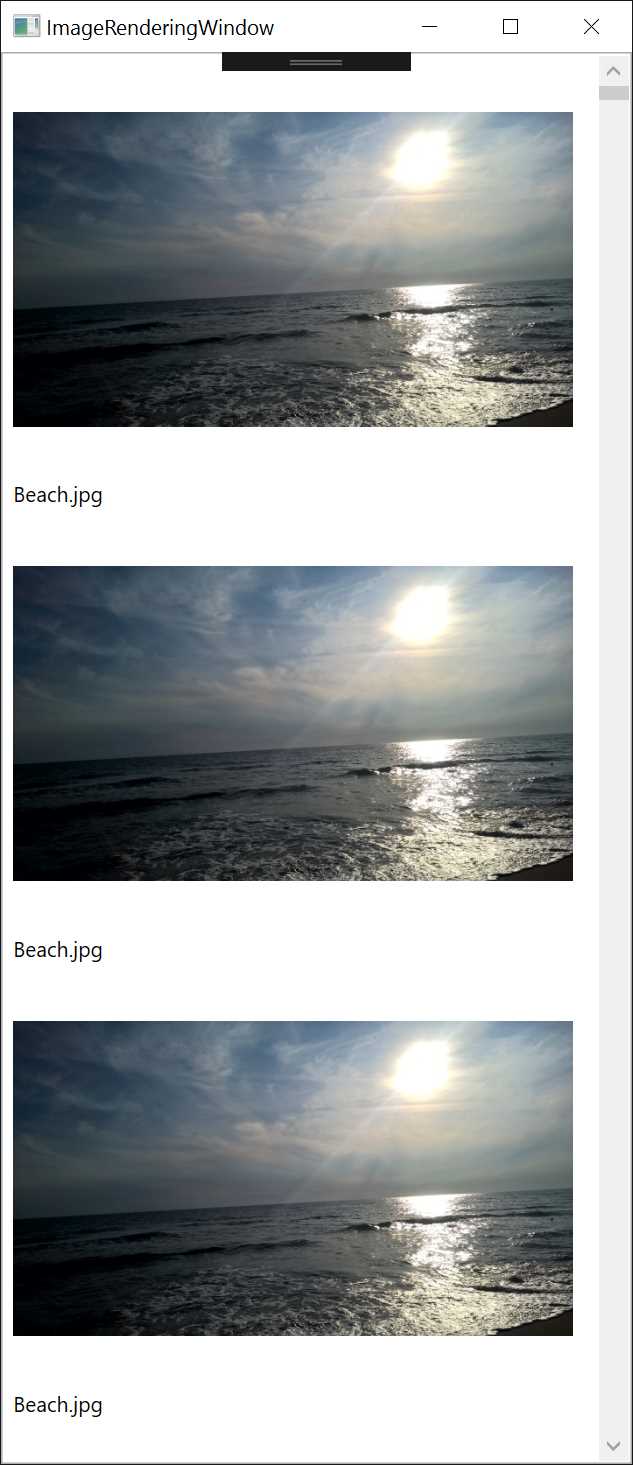
Figure 33: Sample App Showing 1000 Instances of Image
Next, let’s examine how to analyze the UI performance with the integrated Visual Studio tools.
The Application Timeline tool
Visual Studio 2015 brings to WPF a diagnostic tool called the XAML UI Responsiveness Tool. It was originally developed for Windows Store apps and was introduced in Visual Studio 2013; it is certainly still available in version 2017. Now this tool is called Application Timeline (or, more simply, Timeline), and you can leverage it with your WPF applications. The Timeline tool analyzes the application’s behavior in order to help you detect where it spends time. Though this tool can detect events such as (but not limited to) startup, disk I/O, and rendering the UI (including thread utilization), its focus is investigating the UI behavior in more detail. In order to understand how it works, press ALT+F2 (or Debug, Performance Profiler) to show the so-called Diagnostics Hub, which contains a list of performance analysis tools, then select Application Timeline (see Figure 34).
Tip: If it looks disabled, make sure you first unselect any other diagnostic tool.
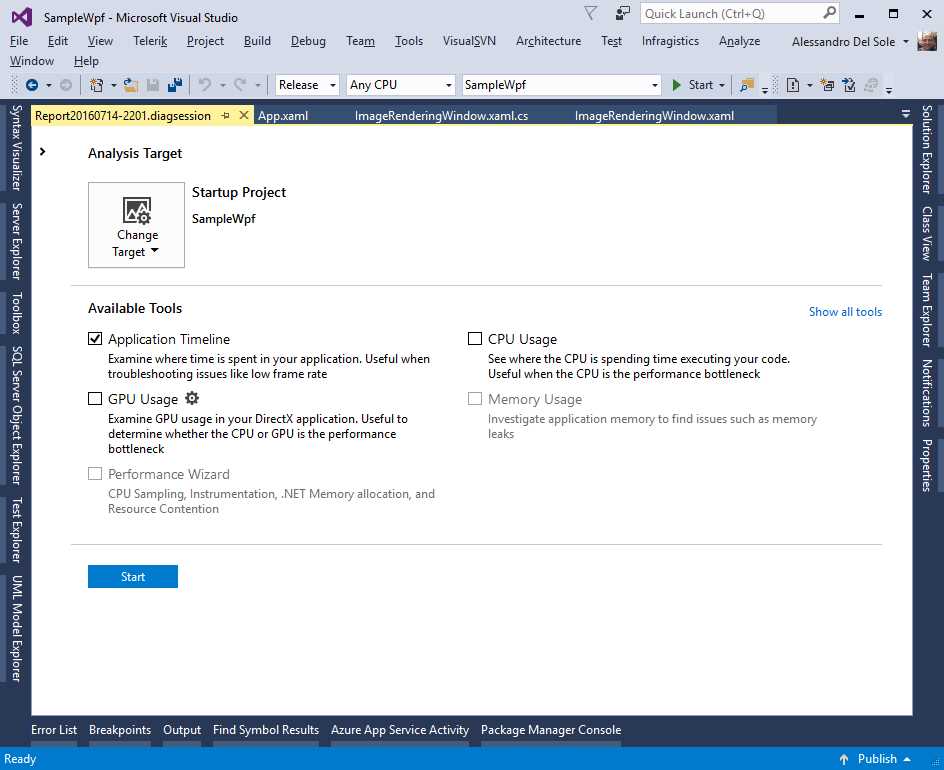
Figure 34: Selecting the Application Timeline
Because the Timeline is a specialized profiler, for accurate results you should first change the output configuration for your project from Debug to Release. When ready, click Start so that the application will start with an instance of the profiler attached. When the application has started and all images have been loaded, play a bit with the user interface—for example, resize the window or scroll the image list. When your application has been working for a while in different situations, click the Stop Collection hyperlink in Visual Studio. After a few seconds, you will get a very detailed visual report (see Figure 35 for an example).
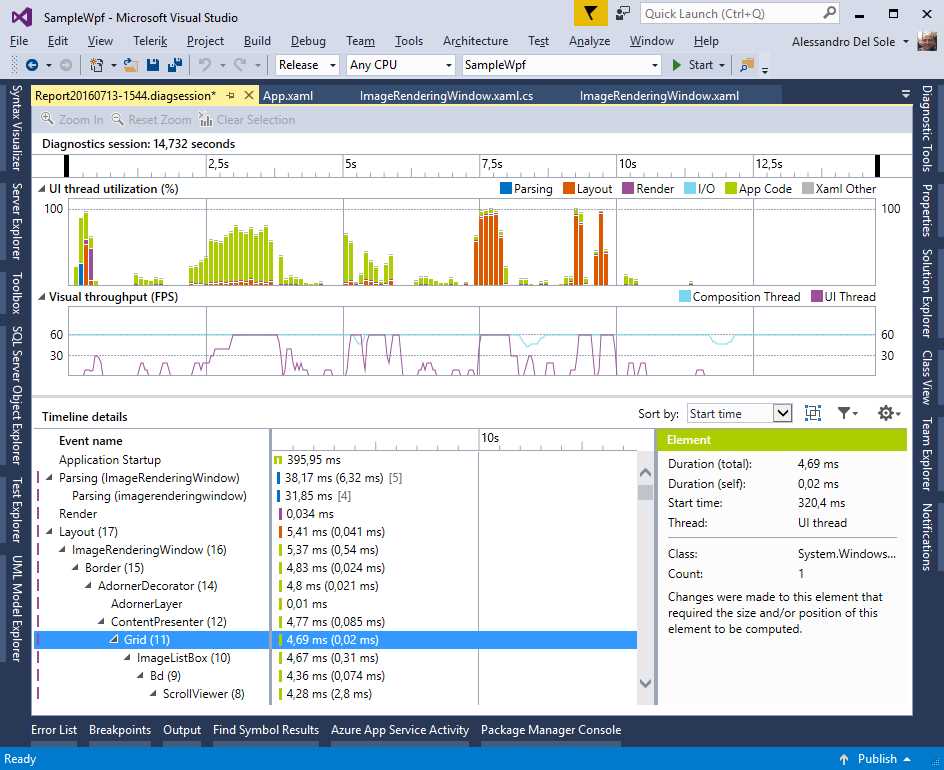
Figure 35: Report Generated by the Application Timeline
The report consists of four main areas: the Diagnostic session, the UI thread utilization, the Visual throughput (FPS), and the Timeline details. Let’s discuss each more thoroughly.
The Diagnostic session
The Diagnostic session report shows information about the duration of the diagnostic session. You can use the black markers to analyze a specific interval of time during the application lifetime. When you select a specific interval, the other areas will automatically show diagnostic information for that interval.
UI thread utilization
The UI thread utilization section gives a percentage for how the UI thread has been exploited by different tasks managed by the runtime. You can understand how many resources have been consumed by the XAML parser (blue), how many consumed in rendering the user interface (dark orange), how many consumed in executing the app code (light green), how many consumed in disk I/O (light blue), and how many consumed in other tasks related to XAML (not parsing). In conjunction with the Diagnostic session report, this can be very useful for understanding which areas of your code have the most negative impact on the overall performance at a specified interval of time in the application lifetime. For instance, in Figure 35 you will see there is an important impact in rendering the layout at 7.5 seconds after the application startup, which is the point at which 1000 images were rendered.
Visual throughput (FPS)
This section shows how many frames per second (FPS) have been rendered during the application lifecycle. For timing, you can take the Diagnostic session as a reference. This tool is very straightforward—it can show frames in both the UI thread and the composition thread. If you pass the mouse pointer over the graphic, you will see a tooltip showing frames per second for both threads at the given time.
Note: If you are not familiar with the composition thread, it is a companion thread for the UI thread, in that it does some work that should otherwise be done by the UI thread. The composition thread is normally responsible for combining graphic textures and sending them to the GPU for rendering. This is all managed by the runtime; by invoking the composition thread, the runtime can make an app stay much more responsive and you, the developer, need not do any additional work manually.
Timeline details
At the bottom of the report, you will find the Timeline details, which provide further information about events in the application lifecycle and about UI elements involved in such events. More specifically, you can see a list of events and UI elements. For each, you can see the time in milliseconds. For example, if you consider Figure 35, you can see how the Application Startup event has required 395.95 milliseconds. Some events, such as Layout, are split into multiple parts, which is typical because rendering the layout requires two different threads (UI and Composition) that run asynchronously. This means each node can be expanded to get more information. When you expand a Layout node, you also see the visual tree of UI elements involved in that particular event.
These UI elements can be expanded to show nested controls and types. When you click an event or object, you will also see detailed information on the right side of the report, including the number of instances of an object, the containing .NET type, and the time required to render a UI element. For example, if you again consider Figure 35, you’ll see a description of a Grid on the right side of the report that is currently selected in the list of UI elements; such a description also shows how much time it took to render this Grid in milliseconds, the thread that was responsible for drawing the element (the UI thread in this case), and the count, which is one instance. Having the option to discover how many instances of an object have been created will help you understand which UI elements might negatively impact the overall UI performance.
Changing the analysis target
Analysis tools listed in the Diagnostics Hub can run against a number of possible targets. If you look at Figure 34, you’ll see a button called Change Target. Click this button and you will see a list of possible analysis targets, such as a running or installed Windows Store app, an existing .exe file, and even an ASP.NET application running on IIS (see Figure 36).
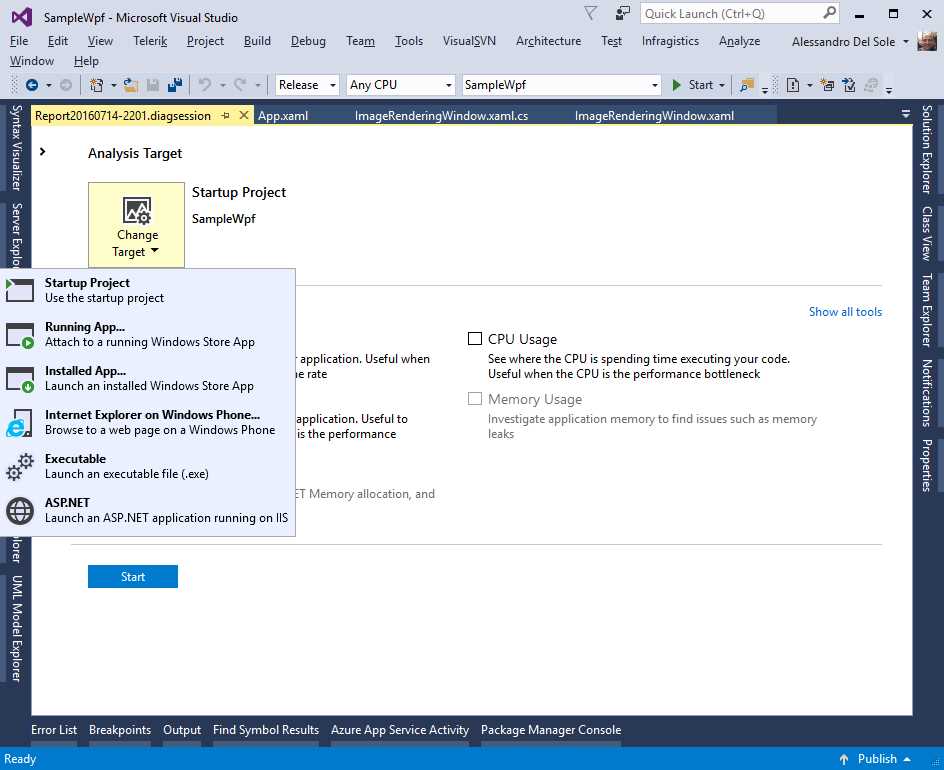
Figure 36: Possible Analysis Targets
The Application Timeline can only run against the first three targets: Startup Project, Running App, and Installed App. Both Running App and Installed App refer to Windows Store apps, not WPF applications. More precisely, note that if you select Installed App, you will be prompted with a list of installed Windows Store apps on your machine (which includes Universal Windows apps), as you can see in Figure 37.
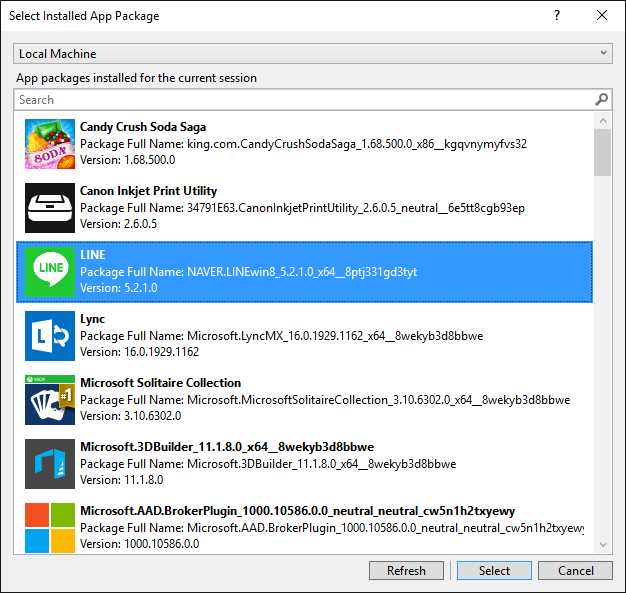
Figure 37: Selecting an Installed Windows Store App as the Analysis Target
Simply select an application, click Select, then start the diagnostic session with the Application Timeline.
Chapter summary
Performance is one of the most important aspects of any professional application. You can build a beautiful application, but if it is slow or unresponsive, customers and users will be very dissatisfied. This is even more important with WPF applications in which the user interface natively supports media, documents, and XAML data-binding. In order to help you analyze the performance of the user interface in your applications, Visual Studio 2015 ships with a tool called Application Timeline that analyzes events such as startup and disk I/O but focuses on how much time it takes to render the application’s user interface, which will allow you to understand which elements are consuming which resources at a particular point in the application lifecycle. By analyzing the report produced by Timeline, you will be able to understand which parts of the user interface need to be restructured in order to improve the customer experience.
- 100+ essential WPF UI controls like DataGrid, Charts, and Diagram.
- 10+ built-in themes, plus Theme Studio app for designing custom themes.
- Powerful document processing libraries for Excel, PDF, Word, and PowerPoint file formats.