
Windows Azure SQL Reporting Succinctly®

CHAPTER 7
Report Access
After content is uploaded, user accounts are added, and permissions are assigned, the SQL Reporting server is ready for report readers to use. Report readers are users who have the fewest privileges on a SQL Reporting server. The simplest way for this group of users to access a report is to use the SQL Reporting report server link to browse the available content and click a report’s link to view it. Another option is to provide a report reader with a URL to a specific report, which can also include commands to control the rendering experience. Your third option is to have the report reader open an application that uses the ReportViewer control to display a report. In this chapter, I explain these options from the perspective of a report reader.
Web Service URL
To browse the contents of the SQL Reporting server, you must have the URL for the server and credentials to log into the server. A report server administrator provides you with the server URL which looks similar to this: https://xyz123.reporting.windows.net:443/reportserver. When you open this URL in your web browser, you are prompted for the user name and password assigned to you. After you successfully enter your credentials, the top-level items are displayed in your browser as shown in Figure 52. You can only view items for which you have been granted permissions.
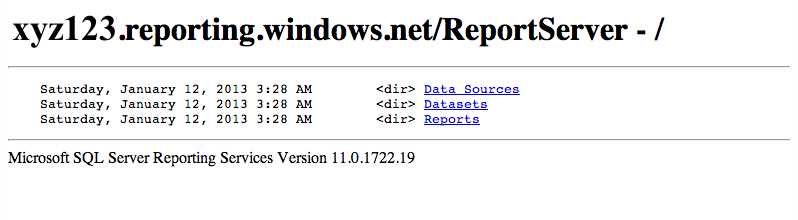
- SQL Reporting server home directory
Click the directory links to view the item it contains or click a report link to display the report as shown in Figure 53. By default, the report renders in HTML format and includes the HTML Viewer toolbar above the report. This toolbar contains buttons that you use to navigate the report, search for text within the report, export the report to a new format, or refresh the report. If the report contains report parameters, they are displayed above the HTML Viewer toolbar. After you change parameter values, click View Report to update the report with the new values.
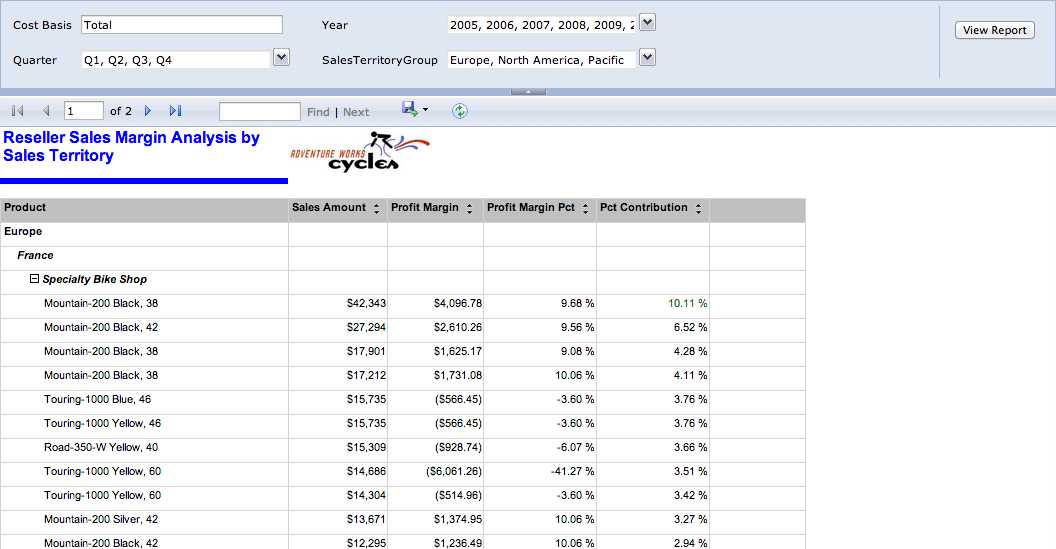
- Report in HTML Format
Note: If you are the SQL Reporting administrator, you can also navigate the folder hierarchy in the SQL Reporting management portal and click a report to open a new tab in your browser. You must enter user credentials and then you can view the report in the browser, as shown in Figure 53.
Rendering Formats
When users want to view reports but are unable to connect to the Internet, or when they want to use the information in a report in different ways, they can export the report to an alternate rendering format. SQL Reporting supports seven different rendering formats as alternatives to the online HTML format used to display reports in the browser. These seven formats are organized into three types of renderers:
- Soft Page-Break. The document adheres to the report layout in the RDL and is optimized for viewing online: Excel, Word, and MHTML.
- Hard Page-Break. The document adheres to the report layout in the RDL and is optimized for print: TIFF and PDF. With these formats, you should check the Width, Height, and Margin properties are set correctly.
- Data. The output of the renderer is raw data and excludes formatting defined for the report layout: CSV, XML.
Excel
This export to Excel produces a file with an XLSX extension which is compatible with Excel 2007 and newer versions. It produces a single cell for each text box, chart, sparkline, data bar, gauge, indicator, map, and image in the report, but uses multiple cells to render data regions, subreports, rectangles, and the report body. In some cases, the render merges multiple cells when report item edges are not aligned. Background images for report items are ignored unless an image is assigned to the BackgroundImage property for the body of the report.
In most cases, formatting properties are preserved in the worksheet wherever possible. If you do not define pagination properties in the report, SQL Reporting renders the report as a single worksheet in the Excel workbook. On the other hand, if you define rules for pagination, each page break based on a group generates a separate worksheet in the XLSX file. You can name each sheet by configuring the PageName property of the group.
When an Excel workbook renders, the items contained in the page header render in the uppermost rows of a worksheet. By contrast, page footers become part of the Excel footer. A document map is added to the workbook as the first worksheet and includes document map links, as shown in Figure 54, which allows you to jump to a specific location in the Excel workbook.
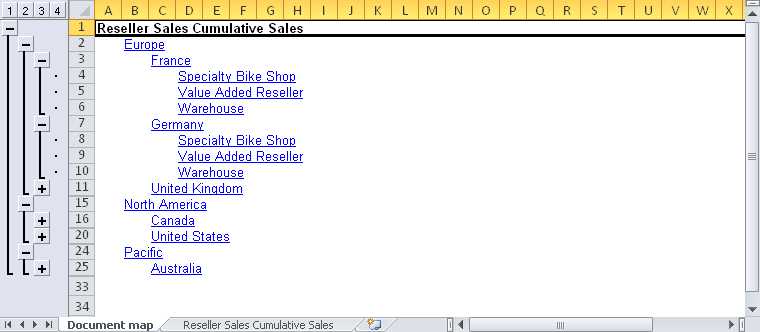
- Document map links in Excel
Note: The Excel renderer supports a maximum of seven levels in a document map.
The Excel renderer also supports hyperlink and bookmark actions, but does not support interactive sorting. Also, expressions resolve as constant values in the workbook. The renderer produces charts as images and does not include the underlying data.
Word
This renderer produces a DOCX file, as shown in Figure 55, and preserves many interactive features, such as hyperlinks and actions. However, it does not render a document map as you might expect. Instead, it creates Word table of contents labels from the document labels, but you must use the References tab on the Word ribbon to create the table of contents in the document. Furthermore, the Word renderer behaves like Excel by creating static images for graphical data regions and images. However, be aware that it excludes background images in the report or the report body.
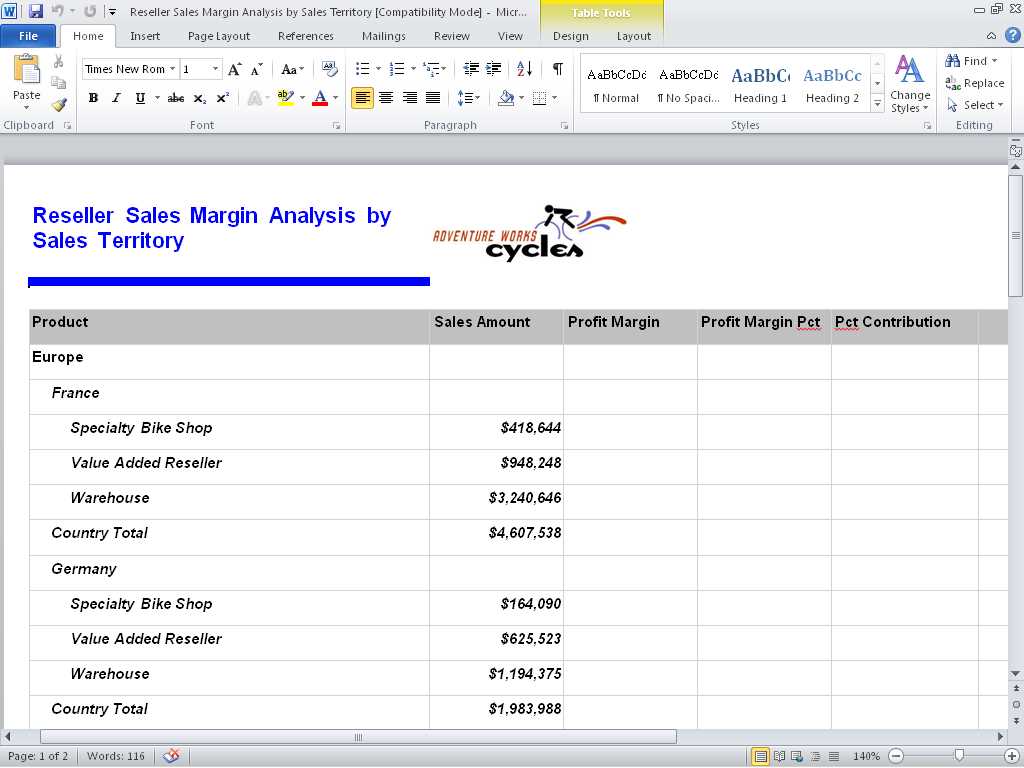
- Viewing a report rendered as a Word document
The Word renderer converts the page header and page footer in the report to a document header and footer, but ignores the Height property for these items. It also uses the report, body, and margin size settings that you define for the report, but the maximum width of a report is 22 inches.
MHTML
When you open a report from the browser or the SQL Reporting management portal, the report renders as HTML by default and all interactive features are enabled. If explicit page breaks are defined in the report or if the report is very large, you must use the navigation buttons in the HTML Viewer toolbar to move from page to page. If you want to save this report as a single page or embed it in an email message, you can save it as an MHTML file. When you do this, you lose the ability to toggle visibility. You must click the toggle item in the HTML version of the report before you perform the export to change the visibility state.
The PDF renderer produces a report that matches what you see online. That is, any report items in a hidden state are not visible in the PDF version of the report. Furthermore, the PDF file does not support interactive features, such as toggling visibility, interactive sort, bookmarks, and drillthrough. On the other hand, it does support a document map, as shown in Figure 56, and the Go To URL action.
- Viewing a report rendered as a PDF document
TIFF
You can render a report as a multiple page image file in the Tagged Image File Format (TIFF). Like the PDF renderer, the TIFF renderer does not support interactive features and renders only the current view of the report.
CSV
The CSV renderer converts the data in your report data to the lowest level of detail. It also adds a comma delimiter between each field and a carriage return and line feed at the end of each record. All detail rows are included in the file, including rows that are hidden in the HTML version of the report. The column names are listed in a header row of the file. Be aware that the following items do not render: page header, page footer, lines, images, rectangles, or totals calculated by using expressions in a group or tablix footer. Likewise, interactive features are excluded.
Each item in the report renders as a separate group of rows and columns in the output file, as shown in Figure 57. Each report item type has its own rendering behavior, as follows:
- Freestanding text box. A freestanding text box renders with a column header and a row value of its contents.
- Table. A table includes a row and column at the lowest level of detail it contains, which is not necessarily the level of detail visible in the report. Total rows or columns in footers are not included.
- Matrix. A matrix includes a row and column at the lowest level of detail it contains, which is not necessarily the level of detail visible in the report. Total rows or columns in footers are not included.
- List. A list includes a row for each detail row or group instance it contains. If the list contains nested items, the parent group instance value repeats in each row of the nested item.
- Subreport. If the subreport is nested inside another report item, the parent item values repeat for each row of the subreport contents.
- Chart. A chart includes a row for each combination of value and category, typically represented as a single data point in the chart. If the chart contains multiple series, the label for each series is included in the rows preceding the value for that series. Data bars and sparklines have the same rendering behavior, but do not include series labels.
- Gauge. A gauge includes a single row containing the scale’s minimum and maximum values, the range’s start and end values, and the pointer value.
- Indicator. An indicator includes a single row with the current indicator state, available states, and the indicator value.
- Map. A map includes a row for each spatial data value and its corresponding label.
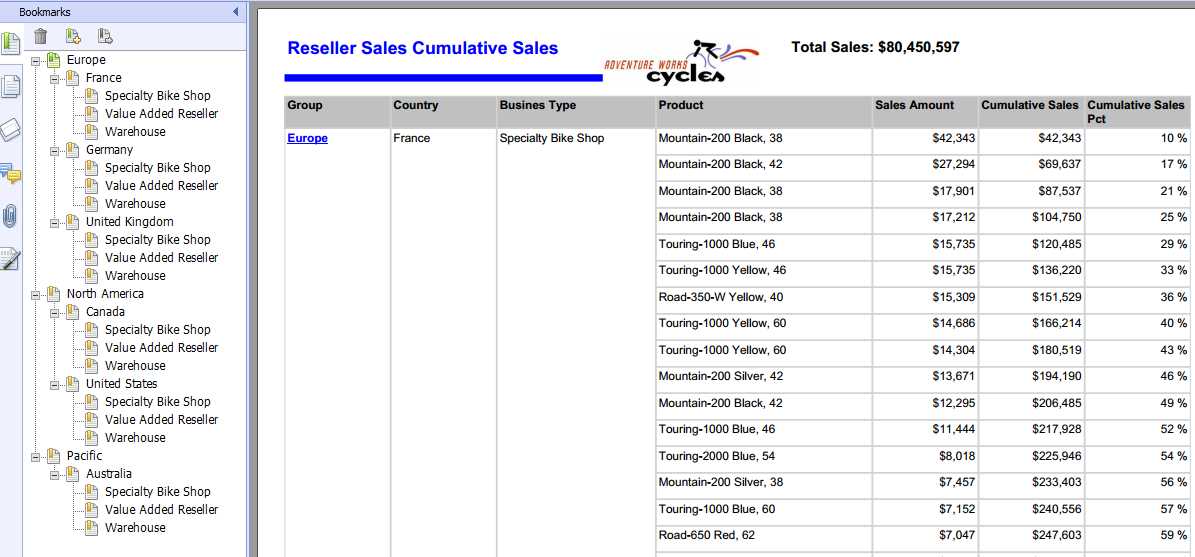
- Viewing a report rendered as a CSV file
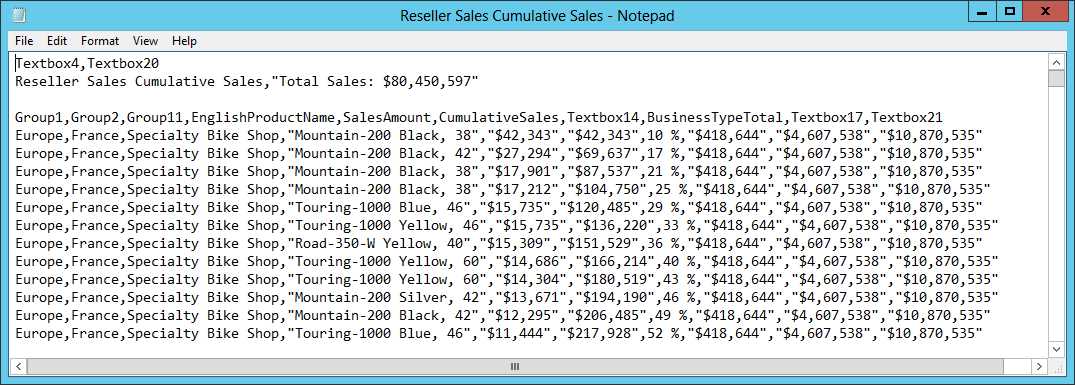
XML
The XML renderer exports data in a hierarchical structure, as shown in Figure 58. The names of report items in the report definition become XML elements in the exported file, so consider renaming report items from a default name like Textbox1 to a more descriptive name. The XML file includes all detail rows, including hidden data if the row can be toggled to a visible state. Each report item type has its own rendering behavior, as follows:
- Report. The report is the top-level element in the XML file.
- Freestanding text box. A freestanding text box renders as an attribute in the element of its parent container.
- Data region and rectangle. In this context, a data region is a table, matrix, list, chart, data bar, or sparkline. Data regions and rectangles render as child elements of their parent containers. In a chart, each series is a child element of the chart.
- Group and details. Each instance renders as a child element of its parent data region. Group instances include both row groups and column groups.
- Text box inside data region. A text box that is not freestanding renders as a child element of its parent data region.
- Map. The map itself renders as a child element of its parent container. Each map layer renders as a child element of the map and includes elements for each spatial member.
- Gauge. A gauge renders as an element of its parent container and renders the scale’s minimum and maximum values, the range’s start and end values, and the pointer value as attributes of the gauge element.
- Indicator. An indicator renders as an element of its parent container and renders the current indicator state, available states, and the indicator value as attributes of the indicator element.
- Viewing a report rendered as an XML file
My Reports Folder
The My Reports folder is a user-specific folder available for storing reports. Only the named user and report server administrators have access to an individual’s My Reports folder. The My Reports feature is disabled on the server by default and must be enabled by a report administrator before use, as described in Chapter 4, Report Management. The My Report folder is visible when browsing the server through the Home page of the Report Manager if the feature is enabled and if you have been assigned to the My Reports role (or the role assigned to users of this feature).
After your My Reports folder is added, you can add content to it in the same way that content managers add content to other folders on the report server. That way, you can keep your favorite reports in one location rather than searching through the folder hierarchy on the SQL Reporting server.
If you are an SQL Reporting administrator, you can see the contents of any user’s My Reports folder. You can move reports from this folder, and delete reports if necessary.
URL Access
Rather than browse the SQL Reporting server’s folder directories in your browser, you might have access to a portal that includes direct links to specific reports through URL access. The link can include additional commands to change parameter default values, hide some or all of the HTML Viewer toolbar, or export the report to a different format. Role assignments remain in effect with URL access, so you cannot open a report if you do not have adequate permissions. You might store this URL in a document for quick access to a report that you reference frequently or you might be responsible for constructing a portal page with URL access links.
Report URL
You can locate a report’s URL by first browsing the SQL Reporting server as described earlier in this chapter. Click the report’s link and then review the URL in the browser’s Address bar. For example, the URL for the report shown in Figure 38 looks like this: https://xyz123.reporting.windows.net/ReportServer/Pages/ReportViewer.aspx?%2fReports%2fReseller+Sales+Margin+Analysis+by+Sales+Territory&rs:Command=Render
You can copy this URL and use it in a document, email, or a webpage.
Tip: You can also abbreviate a report URL by eliminating the /Pages/ReportViewer.aspx and &rs:Command=Render portions of the URL. You can also eliminate the encoding by replacing the %2f and + characters with forward slashes and spaces, respectively.
URL Access Parameters
You are not limited to using the default settings for a report’s rendering, toolbar, or parameters. Instead, you can append URL access parameters that provide additional options.
Report Parameters
For each parameter that you want to override in a report, you include a name/value pair as a string and append the string to the report’s URL. If the parameter accepts multiple values, you append multiple name/value pairs like this:
https://xyz123.reporting.windows.net/ReportServer/Reports/Reseller Sales Margin Analysis by Sales Territory&Quarter=1&Quarter=2 |
Note: Be sure to use the parameter’s value and not its label in the name/value pair.
HTML Viewer Parameters
You can also use URL access parameters to modify the controls that are displayed in the HTML Viewer. For example, you might decide to exclude the Parameters section of the HTML Viewer because you provide parameters values in the URL. Table 5 lists the available commands to append to the URL.
HTML Viewer Parameters
URL Access Parameter | Description | Example |
DocMap | Hide a document map. | &rc:DocMap=false |
FallbackPage | Display the specified page if a search fails. | &rc:FallbackPage=1 |
FindString | Search for a string in a report using StartFind and EndFind to specify the range of pages to search. | &rc:FindString=Mountain-200&rc:StartFind=1&rc:EndFind=5 |
Parameters | Hide parameters section of the toolbar. | &rc:Parameters=false |
Section | Display the specified page. | &rc:Section=5 |
Toolbar | Hide the HTML Viewer toolbar. | &rc:Toolbar=false |
Zoom | Increase or decrease the report size by the specified percentage or fit defined by Page Width or Whole Page. | &rc:Zoom=50 or &rc:Zoom=Page Width |
Report Server Parameters
Another way to use URL access parameters is to issue commands to the report server. You might do this when you want to export the report to a format other than HTML by using the Format parameter. Not all report server parameters display a report, though. For example, you can display report server contents by using the Command parameter. Table 6 lists the available parameters.
Report Server Parameters
URL Access Parameter | Description | Example |
|---|---|---|
ClearSession | Remove a report from the current report session (including all executions of the report with different parameter values). | &rs:ClearSession=true |
Command | Perform an operation on a catalog item:
| &rs:Command=ListChildren |
Format | Render a report in the specified format (default HTML4.0) | &rs:Format=excelopenxml |
GetNextStream | Get the next chunk of a persisted stream (default=false). | &rs:GetNextStream=true |
ParameterLanguage | Define the language for parameters independent of the browser language. | &rs:ParameterLanguage=en-us |
PersistStreams | Render a report in a single persisted stream or one chunk at a time (default=false). | &rs:PersistStreams=true |
SessionID | Specify an active report session. | &rs:SessionID= 1lvwaoji1ok1sdyujn1dg5un |
ShowHideToggle | Toggle the visibility of a section of the report. | &rs:ShowHideToggle=1 |
- 1800+ high-performance UI components.
- Includes popular controls such as Grid, Chart, Scheduler, and more.
- 24x5 unlimited support by developers.