
Web Servers Succinctly®

CHAPTER 12
Stress Testing
The source code presented in this section is in the folder Examples\Chapter 12 in the Bitbucket repository. The Visual Studio solution file is in the Chapter 12\Clifton.WebServer folder.
Stress testing, or load testing, is a Pandora’s box. Once you open it, questions arise regarding whether the test results are accurate, whether the test itself is correct, whether it’s testing the right thing, and how to even understand the test results. Given that, we’ll spend a little time exploring this rocky terrain.
First, let’s create a minimal workflow for each request:
public static void InitializeWorkflow(string websitePath) { StaticContentLoader sph = new StaticContentLoader(websitePath); workflow = new Workflow<ContextWrapper>(AbortHandler, OnException); workflow.AddItem(new WorkflowItem<ContextWrapper>(sph.GetContent)); workflow.AddItem(new WorkflowItem<ContextWrapper>(Responder)); } |
Code Listing 101
This is the workflow for a static page server. All it does is respond to the request with the content of a file associated with the URL. As it turns out, additional workflow routines such as routing have negligible impact on the performance tests (this is a clue to something!).
Here’s my test code, intended to be able to hit the server from multiple threads. Replace the IP address with your server’s IP address. I use an IP address instead of localhost because I want to run these tests on a separate machine.
class Program { static int n = 0; static void Main(string[] args) { List<Thread> threads = new List<Thread>(); for (int i = 0; i < 1; i++) { Thread thread = new Thread(new ThreadStart(RunForOneSecond)); thread.IsBackground = true; threads.Add(thread); } threads.ForEach(t => t.Start()); Thread.Sleep(1250);
Console.WriteLine("Made {0} requests.", n); Console.WriteLine("Press ENTER to exit."); Console.ReadLine(); } static void RunForOneSecond() { DateTime now = DateTime.Now; WebClient client = new WebClient(); client.Proxy = null; try { while ((DateTime.Now - now).TotalMilliseconds < 1000) { Interlocked.Increment(ref n); string downloadString = client.DownloadString("http://192.168.1.21/"); } } catch (Exception ex) { Console.WriteLine(ex.Message); } } } |
Code Listing 102
We’ll start with one thread making requests to the server:
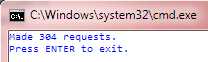
Figure 377: Single Thread Load Test
These numbers, by the way, are quite consistent. Let’s try two threads:
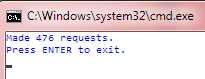
Figure 388: Two Threads Doing Load Testing
Basically, the number of requests that can be processed peaks around four load testing threads (I have eight cores on the test machine, by the way) and with a maximum throughput of around 600 requests per second. Incidentally, these numbers don’t change regardless of what technique is used for listening to a request or how many listeners are listening.
But what are we actually measuring? Certainly we can say we’re measuring the entire request flow, from initiating the request to receiving the response. There’s a lot in the middle here. Let’s perform instrumentation (without using workflows, so we have minimal impact) on the request-received to response-given time so we can see how much time is actually spent in the workflow itself. Note how we start right after obtaining a context, and we stop the clock right before sending the context. This eliminates all the .NET and operating system pieces before and after our server code. First we’ll refactor the ContextWrapper to add a stopwatch that starts running the instant the wrapper is instantiated, which happens right after we receive a context.
public class ContextWrapper { public HttpListenerContext Context { get; protected set; } public Response PendingResponse { get; set; } public Session Session { get; set; } public System.Diagnostics.Stopwatch Stopwatch { get; set; } public ContextWrapper(HttpListenerContext context) { Context = context; Stopwatch = new System.Diagnostics.Stopwatch(); Stopwatch.Start(); } |
Code Listing 103
Then, in the responder, we’ll stop the stopwatch and add the time to our cumulative count (I’ve verified that I’m using the high-resolution performance counter for the stopwatch):
public static WorkflowState Responder( { wrapper.Stopwatch.Stop(); Server.CumulativeTime += wrapper.Stopwatch.ElapsedTicks; ++Server.Samples; // ... etc ... |
Code Listing 104
Now, I’m going to add the router back into the workflow so we can display an average of the processing time through a URL, with:
routeTable.AddRoute("get", "loadtests", new RouteEntry() { RouteHandler = (continuation, wrapper, session, pathParams) => { long nanosecondsPerTick = (1000L * 1000L * 1000L) / if (Server.Samples == 0) { wrapper.SetPendingResponse("<p>No samples!</p>"); } else { long avgTime = Server.CumulativeTime * nanosecondsPerTick / Server.Samples; string info = String.Format("<p>{0} responses, avg. response time = Server.CumulativeTime = 0; Server.Samples = 0; wrapper.SetPendingResponse(info); } return WorkflowState.Continue; } }); |
Code Listing 105
Now we should see what our processing time inside the server is:
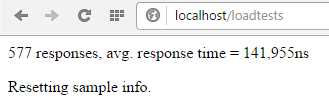
Figure 39: Internal Processing Time
So, let’s call that 150 microseconds to process the request. Contrast this to our load test, which is telling us that an average request takes more than 1.5 milliseconds.
I interpret this to mean that the overhead of our load testing is 10 times the actual processing time of the request. I would make the conclusion then that our server, doing something rather minimal, could actually handle some 6,000 requests per second.
Let’s try something different to vet our tests further. Instead of loading the index.html file, let’s simply return that data in a specific route, and change our test to use that route:
routeTable.AddRoute("get", "sayhi", new RouteEntry() { RouteHandler = (continuation, wrapper, session, pathParams) => { wrapper.SetPendingResponse("<p>hello</p>"); return WorkflowState.Continue; } }); |
Code Listing 106
And, in our test program (you will have to change the IP address):
string downloadString = client.DownloadString("http://192.168.1.21/sayhi"); |
Code Listing 107
Now look at the results (the counts are off by two because we’re also counting browsing to the loadtests page):
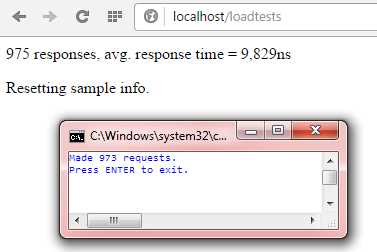
Figure 40: Load Test Without A File Read
Wow, we get a third more responses with four threads making queries, and the response time in our server is down to 9 microseconds, translating, at least in theory, to the ability to process more than 100,000 requests per second.
This gives you an idea of the overhead of….what? The operating system? The .NET framework? The test process? It’s really hard to say.
What Can We Take Away From This?
The takeaway here is if you want a high-performance server, watch very carefully what your route handlers are doing, and your access to the file system, databases, and more. Lots of things in your application contribute to degrading the performance of the web server.
For example, adding the view engine to our last test resulted in an almost hundredfold increase in response time: 700 microseconds on average. When you consider the number of requests that may be coming in to your website, that adds up to a lot of potentially unnecessary overhead.
- 1800+ high-performance UI components.
- Includes popular controls such as Grid, Chart, Scheduler, and more.
- 24x5 unlimited support by developers.