
Visual Studio 2017 Succinctly®

CHAPTER 7
Debugging and Testing Improvements
Debugging and testing code are two fundamental tasks in the application development lifecycle, and it should be no surprise that Visual Studio 2017 introduces important improvements for both. Such improvements make debugging and testing faster but still efficient while you keep your focus on the active editor. This chapter will describe new features, but it will also walk through updated tools you already know and that, in Visual Studio 2017, come to a new life.
Introducing Run to Click
When we are debugging, stepping through lines of code is one of our most common operations. We use breakpoints, and then use features such as Step Into, Step Over, or Step Out in order to understand the behavior of code blocks, local variables, and more generally, the application execution flow. Before Visual Studio 2017, we had to introduce temporary breakpoints to continue the execution from a breakpoint to a certain point in our code. Visual Studio 2017 makes a step forward and introduces a new feature called Run to Click. To understand how this feature works, consider Figure 64, in which you can see that a breakpoint has been hit and the application is in break mode.
![]()
Figure 64: The Run to Click Icon
When you hover over a line of code, a green glyph appears near the line, as shown on line 43 of the code file in Figure 64. This glyph represents the Run to Click button. If you click it, your code will be executed to that line, without the need for temporary breakpoints. Actually, the line where Run to Click is activated is highlighted but not executed, exactly as it would happen if a breakpoint was set on that line (see Figure 65).
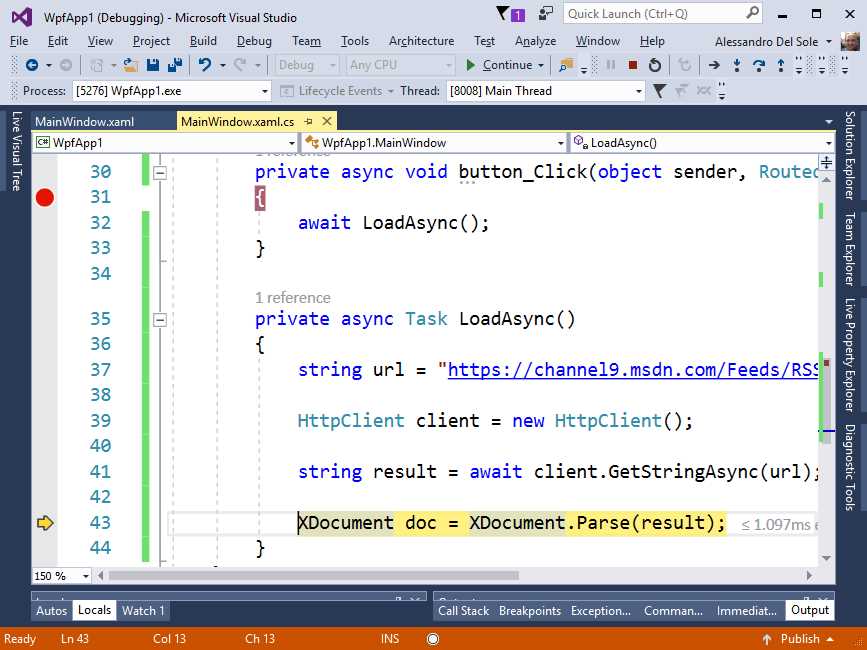
Figure 65: Run to Click Stops at a Line of Code without a Breakpoint
You can then continue to use the Run to Click button and execute code to a specific point, thereby avoiding temporary breakpoints.
Tip: Keep in mind that Run to Click works only in break mode, which means it is not available when the application is running.
Updated diagnostic windows
Visual Studio 2015 introduced the Diagnostic Tools window, which shows application events, memory and CPU usage, and other diagnostic information at debugging time. This tool window appears by default when you start debugging your application. In Visual Studio 2017, the Diagnostic Tools window has been updated with a view called Summary (see Figure 66).

Figure 66: The New Summary View in Diagnostic Tools
This new view contains a summary of the number of application events (Show Events), exceptions, IntelliTrace events, Application Insights (if applicable), and UI Analysis events for UWP apps. It provides shortcuts to take snapshots of the managed heap and to enable or disable CPU profiling.
Tip: You can enable or disable specific IntelliTrace events by going to Tools > Options > IntelliTrace > IntelliTrace Events.
Note: UI Analysis events are a new feature in Universal Windows Platform that detects accessibility issues. They will be addressed in Chapter 8, “Visual Studio 2017 for mobile development.”
This new view provides quick insight into what’s happening at debugging time, then you can use the other tabs for further details.
Analyzing exceptions with the Exception Helper
The Exception Helper is a pop-up that appears when an unhandled or thrown exception occurs at debugging time. Through the Exception Helper, Visual Studio shows details about the exception. Previous versions of Visual Studio offered the Exception Assistant and Exception Dialog tools, which took different approaches to productivity. In Visual Studio 2017, the Exception Helper has a completely new look and improved behavior. Before we examine the new benefits, let’s look at Figure 67, which shows the updated Exception Helper in action.

Figure 67: The Updated Exception Helper
Let’s summarize what’s new:
- The Exception Helper will appear whether you are debugging managed or unmanaged code.
- When an unhandled exception occurs, the entire line of code is highlighted. This improves code readability. An exception error icon will help you understand why the execution was interrupted.
- The Exception Helper pop-up is smaller, nonmodal, and less distractive.
- At a glance, the pop-up shows only the exception type, the error message, and whether the exception was thrown or unhandled.
- The pop-up immediately shows any inner exceptions—without the need of additional dialogs.
- In the Exception Settings group, you can specify if the debugger must break the execution when the exception is thrown, and you can exclude specific modules from breaking the execution.
- If you click the Open Exception Settings hyperlink, the exception information will be shown inside the QuickWatch dialog (see Figure 68). This makes it easy to investigate the exception details and to reevaluate an expression.
- You can click the Edit Conditions hyperlink to specify when the execution should be broken by including or excluding specific modules (see Figure 69). This is the only case in which you interact with a modal dialog from the Exception Helper.

Figure 68: The Exception Settings within the QuickWatch Dialog

Figure 69: Editing Exception Conditions
With its new look and behavior, the Exception Helper improves productivity by providing all the information you need while letting you focus on the code.
Introducing Live Unit Testing
Note: This feature is available only in the Enterprise edition and only for C# and Visual Basic, and it assumes you already have basic knowledge of unit testing. If you need some guidance, the MSDN documentation has everything you need to get started.
Live Unit Testing is a new, exciting feature in Visual Studio 2017. It allows for executing unit tests in the background and showing their results and coverage in the code editor as you type. The best way to understand how this feature works is with an example. Create a console application and consider Code Listing 4.
Code Listing 4
namespace ConsoleApp1 { class Program { static void Main(string[] args) { var rh = new RectangleHelpers(); double result = rh.CalculateArea(10, 10); } } public class RectangleHelpers { // Calculate the area of a rectangle. public double CalculateArea(double width, double height) { return width * height; } } } |
The RectangleHelpers class provides a very simple CalculateArea method that returns the area of a rectangle when given width and height. The class is instantiated and the method is invoked in the Main method of the Program class. Now you need to create some unit tests. Right-click the CalculateArea method, then select Create Unit Tests. The Create Unit Test dialog (see Figure 70) appears and asks you to specify basic information for a test project. By default, the test framework is MSTestv2 and the offer is to create a new test project. Leave all the default settings and click OK. Of course, you can change the default settings if you have previous experience with unit testing in Visual Studio. At the time of writing, the supported test frameworks are MSTest, xUnit, and NUnit.

Figure 70: Creating a Test Project
Now you have a test class called RectangleHelperTests and a method called CalculateAreaTest, both available in the RectangleHelpersTests.cs file of the test project. They are decorated with the TestClass and TestMethod attributes, respectively, to instruct Visual Studio that they are within a test project and that they will be used by the proper testing framework and tools. At this point, you need to implement your unit test. Code Listing 5 shows a very simple implementation that checks for equality between the expected and actual results.
Code Listing 5
namespace ConsoleApp1.Tests { [TestClass()] public class RectangleHelpersTests { [TestMethod()] public void CalculateAreaTest() { var rectHelpers = new RectangleHelpers(); double width = 3; double height = 2; Assert.AreEqual(6, rectHelpers.CalculateArea(width, height)); } } } |
Now go back to the Program.cs file. Select Test > Live Unit Testing > Start. After a few seconds, you will see how Visual Studio runs the unit test in the background, showing the results live in the editor (see Figure 71).

Figure 71: Live Unit Test Results in the Code Editor
Instead of running unit tests with Test Explorer, Visual Studio 2017 is able to run tests in the background and, most importantly, associate coverage and results based on the actual code, not on unit tests.
Note: Visual Studio 2017 can associate Live Unit Testing to your code only if unit tests have a reference to an object. In our example, the unit test defines an instance of the RectangleHelpers class, and so it creates a reference. Then Visual Studio 2017 associates the CalculateAreaTest method to the CalculateArea method based on this reference.
Icons you see in the code editor will help you understand test results and code coverage. More specifically:
- A green icon with a check symbol means that a piece of code has been covered by a passing unit test.
- A blue icon of a horizontal line represents code that is not covered by any unit tests.
- A red X icon represents code that has been covered by a unit test that did not pass.
- Any of these icons with an overlaid clock icon indicates code that is currently being edited.
Now edit the Assert.AreEqual statement in the CalculateTestArea method as follows to make the test fail:
Assert.AreEqual(5, rectHelpers.CalculateArea(width, height));
While editing, you will notice that the icons show an overlaid clock. When you are done, you will see that the code editor is updated to show the unit test result (failed, in this case), as shown in Figure 72.
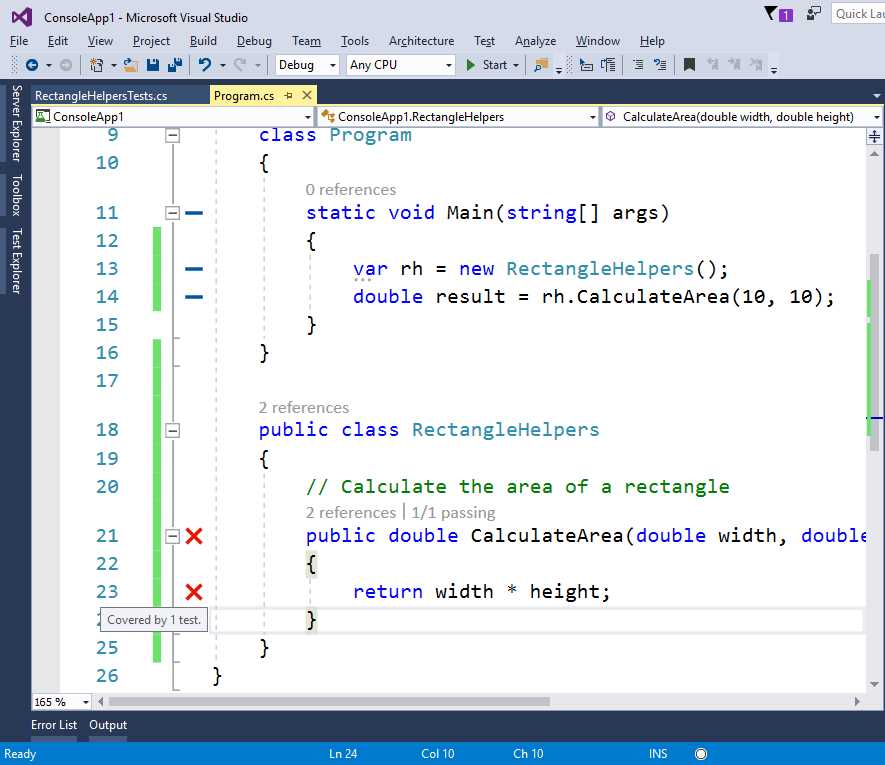
Figure 72: The Code Editor Updated with Unit Test Results
Tip: If you hover over an icon, you will get details about the test method that was invoked in the background (and its results).
Whatever changes you make to your code, Live Unit Testing will run in background, showing the result in the code editor. You can control Live Unit Testing with commands inside Test > Live Unit Testing—for example, Pause, Stop, and Restart. These are only visible when the feature is active.
Miscellaneous improvements
In addition to the major updates described in this chapter, Visual Studio 2017 introduces miscellaneous improvements that make the debugging experience even better. These are briefly summarized in this section.
Accessibility improvements
Most debugging windows (Locals, Watch, QuickWatch, Autos, Call Stack) have been improved for readability for screen readers and other accessibility features.
IntelliTrace events for .NET Core
IntelliTrace, the historical debugger in Visual Studio, now supports tracing events in .NET Core applications. More specifically, you can enable IntelliTrace to track ADO.NET, MVC, and HttpClient events. Go to Tools > Options > IntelliTrace > IntelliTrace events to set events you want to record with .NET Core.
Profiling tools updates
Profiling tools such as the Performance Profiler, CPU Usage, GPU Usage, and Performance Wizard can now attach to a running process. An option for this becomes available when you start the desired profiling tool. The CPU Usage tool has also been improved when working with external code to provide more detailed information.
Support for Chrome with JavaScript
With ASP.NET, if you debug an application using Chrome as the browser, the debugger will run against JavaScript code running in Chrome.
Chapter summary
Debugging and testing are very important tasks in the application development lifecycle, and Visual Studio 2017 introduces new goodies for both. With Run to Click, you no longer need temporary breakpoints to run code to a specific point while in break mode. The Diagnostic Tools window now provides a Summary tab with shortcuts that allow you to keep your focus on the IDE—it provides this along with an updated version of the Exception Helper that shows exception details in a simplified and focused manner. And with Live Unit Testing, you can write code and run unit tests in the background, getting test results and code coverage directly in the code editor, all live as you type.
- 1800+ high-performance UI components.
- Includes popular controls such as Grid, Chart, Scheduler, and more.
- 24x5 unlimited support by developers.