
Visual Studio 2015 Succinctly®

CHAPTER 6
Error List Revisited and Debugging Improvements
Discovering and fixing errors is just as important as writing code. Visual Studio has always offered sophisticated debugging tools; the Error List window is a great companion for examining errors when writing or compiling code. Diagnosing and debugging errors is an area that Microsoft improves tooling for with every new version of the IDE. This chapter describes the Error List window in its new look, and introduces improved debugging and diagnostic tools that will help you solve problems in a more productive way.
The Error List Revisited
The Error List tool window shows the list of compile-time errors that Visual Studio detects while writing code or when you compile your solution. In Visual Studio 2015, the Error List has been revisited and now provides additional useful features.
Tip: The Error List window should open up automatically when compilers encounter any error. However, you can open it up anytime by selecting View > Error List or by pressing CTRL+\, E.
The limit of 100 messages has been removed and now the window shows the full list of errors. To understand the other new features, first consider the code represented in Figure 45 and Figure 46, which contains some errors in different code files. The reason why errors are exemplified in two different files will be clear shortly.
- Simulating some errors—Part 1.

- Simulating some errors—Part 2.
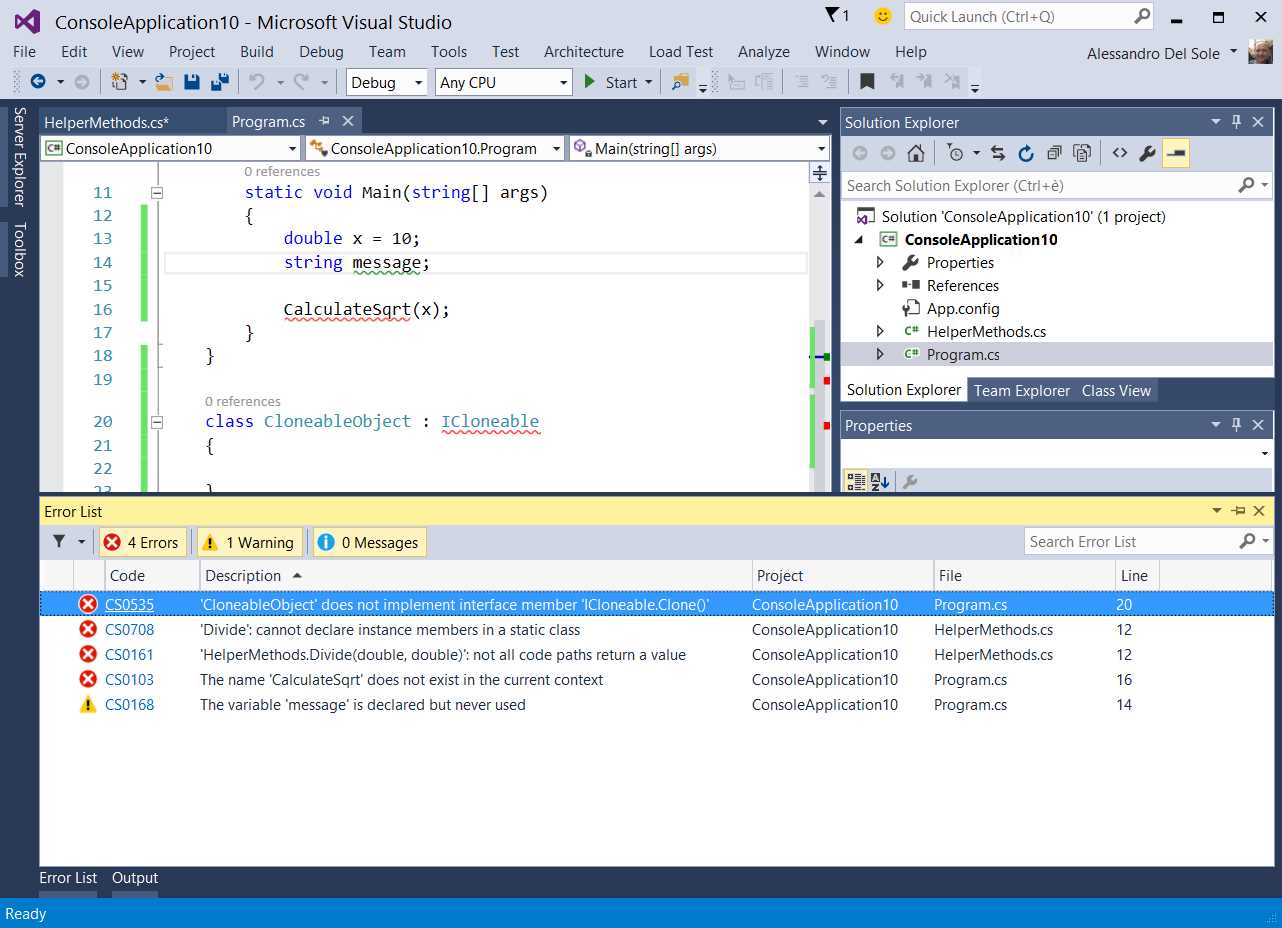
Focus on the Error List; Figure 47 shows a magnified view at this point.

- A more specific view of the Error List window.
The first thing you will notice is an error code for each message. Such an error code represents a specific compiler error; it starts with CS if it is raised by the C# compiler or with BC if it is raised by the Visual Basic compiler.
Note: Additional error codes can be shown if you install (or create) other analyzers, like the Code Analysis for Azure described in
Error codes are presented in the form of hyperlinks, so if you click any error code, Visual Studio 2015 will open up your default web browser and will search the Internet with Bing to find information about both the error code and the error message. Another new feature is filters. You can basically filter the error list by the following columns: code, project, and file. For instance, suppose you want to view errors in some specific files only; click the filter symbol on the File column and select the desired code files, as demonstrated in Figure 48.

- Filtering errors by code file.
Similarly, you could filter the error list by error code or by project; the latter can be very useful with large solutions. The filter symbol on the upper-left corner of the Error List window provides additional ways of filtering the list, as shown in Figure 49. With this option, you can browse errors for the current document, for all open documents, or for the current project, which is also the default filter.

- Viewing only errors in the current document.
You can also filter the list by entering phrases in the search box, but that was introduced in Visual Studio 2013.
Debugging Improvements
Debugging is more efficient when you have the right tools. Microsoft has always paid particular attention to offering sophisticated and advanced debugging tools, and Visual Studio 2015 is no exception. This chapter describes what’s new in the debugging experience with Visual Studio 2015.
Support For Lambda Expressions Debugging
Visual Studio 2015 introduces support for debugging lambda expressions. The community asked for this feature so loudly that Microsoft worked hard to make it available in the new version of the IDE. This feature allows the use of the Watch and Immediate windows to evaluate lambda expressions; it also allows you to step into the code of a lambda expression with proper debugging commands such as Step Into (F11). To understand how it works, consider the following code.
class Program { static void Main(string[] args) { List<string> Names = new List<string>(); Names.Add("Alessandro"); Names.Add("Renato"); Names.Add("Anthony"); Names.Add("Diego");
Debugger.Break(); } } |
The code example is a simple collection of strings containing some names. If you run the code, the execution breaks at Debugger.Break();. Right-click the Names variable and select Add Watch. At this point, the Watch debug window is opened and an instance of the selected object is available for evaluation. The good news is that you can type a lambda expression over the object instance and evaluate it to discover if it works as expected. Figure 50 shows an example where a lambda expression extracts all names beginning with “A.”

- Debugging a lambda expression.
IntelliSense will also work as you type, which makes writing a lambda inside the Watch window a really easy task. Not limited to this, you can also write LINQ queries against supported data sources, like .NET objects, Entity Data Models, LINQ to SQL, and so on. Figure 51 provides an example based on the previous code.

- Debugging a LINQ query.
Similarly, you can evaluate expressions in the Immediate Window, both lambdas and LINQ queries, as shown in Figure 52.

- Evaluating lambdas and LINQ queries in the Immediate Window.
Most developers will love this new feature because it saves time when you need to debug these kinds of expressions.
Visualizing Performance Tooltips: PerfTips
Visual Studio 2015 introduces a new feature called PerfTips (Performance Tooltips), which shows how long it takes to run a specific piece of code while debugging. To understand how PerfTips work, you need a better sample. To do this, create a WPF application that loads an RSS feed from the Internet and then measure how long it takes to execute specific code.
Creating a Sample Application
In Visual Studio 2015, create a new WPF application with either C# or Visual Basic. The goal of the sample application is to download the RSS feed from the official Visual Studio Blog and present some information in the user interface. The first thing you want to do is add a class that represents a single item in the RSS feed; we call such a class Item.
C# Code Example
public class Item { public string Title { get; set; } public Uri Link { get; set; } public string Author { get; set; } public System.DateTime PubDate { get; set; } } |
Visual Basic Code Example
Public Class Item Public Property Title As String Public Property Link As Uri Public Property Author As String Public Property PubDate As Date End Class |
As you can see, this is a simple class that stores information like the blog post author, title, link, and publish date. Next is to write the XAML code for the user interface, which provides a button for canceling the operation and a ListBox control, whose ItemTemplate’s DataTemplate arranges some TextBlock controls vertically inside a StackPanel container. TextBlock controls are bound to properties of the Item class.
<Window x:Class="OpenFeed.MainWindow" xmlns="http://schemas.microsoft.com/winfx/2006/xaml/presentation" xmlns:x="http://schemas.microsoft.com/winfx/2006/xaml" Loaded="Window_Loaded" xmlns:d="http://schemas.microsoft.com/expression/blend/2008" xmlns:mc="http://schemas.openxmlformats.org/markup-compatibility/2006" xmlns:local="clr-namespace:OpenFeed" mc:Ignorable="d" Title="MainWindow" Height="350" Width="525"> <Grid> <Grid.RowDefinitions> <RowDefinition Height="40"/> <RowDefinition/> </Grid.RowDefinitions> <Button Width="120" Height="30" Name="CancelButton" Content="Cancel" Click="CancelButton_Click"/> <ListBox Name="ContentBox" Grid.Row="1" ItemsSource="{Binding}"> <ListBox.ItemTemplate> <DataTemplate> <StackPanel> <TextBlock Text="{Binding Title}" TextWrapping="Wrap" FontSize="16" Grid.Row="1" Tag="{Binding Link}" Foreground="Blue" FontWeight="Bold"
MouseLeftButtonUp="TextBlock_MouseLeftButtonUp"/> <TextBlock Text="{Binding PubDate, StringFormat=d}" Foreground="Red" Grid.Row="2"/> <TextBlock Text="{Binding Author}" Grid.Row="3"/> </StackPanel> </DataTemplate> </ListBox.ItemTemplate> </ListBox> </Grid> </Window> |
Now you need some code that downloads the RSS feed content, parses the corresponding XML, and populates the user interface with the appropriate information (see comments).
Note: You need to add a reference to System.Net.Http.dll in order to use the HttpClient class.
C# Code Example
//The RSS feed URL. private const string FeedUri = "http://blogs.msdn.com/b/visualstudio/rss.aspx"; //Cancellation token required to cancel the operation. private CancellationTokenSource cancellationToken; private void CancelButton_Click(object sender, RoutedEventArgs e) { if (this.cancellationToken != null) { //Cancellation request. this.cancellationToken.Cancel(); } } //Open the selected post in the default browser. private void TextBlock_MouseLeftButtonUp(object sender, MouseButtonEventArgs e) { var content = (TextBlock)sender; var link = (Uri)content.Tag; Process.Start(link.AbsoluteUri); } private async void Window_Loaded(object sender, RoutedEventArgs e) { //Create an instance of the cancellation token. this.cancellationToken = new CancellationTokenSource(); //Load and assign data to the Window's DataContext. this.DataContext = await QueryRssAsync(this.cancellationToken.Token); } private async Task<IEnumerable<Item>> QueryRssAsync(CancellationToken token) { try { //Access via HTTP to the feed and download data as a string. var client = new HttpClient(); var data = await client.GetAsync(new Uri(FeedUri), token); var actualData = await data.Content.ReadAsStringAsync(); //Execute a LINQ to XML query against the feed. var doc = XDocument.Parse(actualData); var dc = XNamespace.Get("http://purl.org/dc/elements/1.1/"); var query = (from entry in doc.Descendants("item") select new Item { Title = entry.Element("title").Value, Link = new Uri(entry.Element("link").Value), Author = entry.Element(dc + "creator").Value, PubDate = DateTime.Parse(entry.Element("pubDate").Value, System.Globalization.CultureInfo.InvariantCulture) }); return query; } catch (OperationCanceledException) { MessageBox.Show("Operation canceled by user"); return null; } catch (Exception ex) { MessageBox.Show(ex.Message); return null; } } |
Visual Basic Code Example
Imports System.Net.Http Imports <xmlns:dc="http://purl.org/dc/elements/1.1/"> Imports System.Threading … Private Const FeedUri As String = _ "http://blogs.msdn.com/b/visualstudio/rss.aspx " 'Cancellation token required to cancel the operation. Private cancellationToken As CancellationTokenSource Private Async Function QueryRssAsync(token As CancellationToken) As _ Task(Of IEnumerable(Of Item)) Try 'Access via HTTP to the feed and download data as a string. Dim client As New HttpClient Dim data = Await client.GetAsync(New Uri(FeedUri), token) Dim actualData = Await data.Content.ReadAsStringAsync 'Execute a LINQ to XML query against the feed. Dim doc = XDocument.Parse(actualData) Dim query = From feed In doc...<item> Select New Item With { .Title = feed.<title>.Value, .Author = feed.<dc:creator>.Value, .Link = New Uri(feed.<link>.Value), .PubDate = Date.Parse(feed.<pubDate>.Value, Globalization.CultureInfo.InvariantCulture)} Return query Catch ex As OperationCanceledException MessageBox.Show("Operation canceled by user.") Return Nothing Catch ex As Exception MessageBox.Show(ex.Message) Return Nothing End Try End Function Private Async Sub MainWindow_Loaded(sender As Object, e As RoutedEventArgs) Handles Me.Loaded 'Create an instance of the cancellation token. Me.cancellationToken = New CancellationTokenSource 'Load and assign data to the Window's DataContext. Me.DataContext = Await QueryRssAsync(Me.cancellationToken.Token) End Sub Private Sub CancelButton_Click(sender As Object, e As RoutedEventArgs) If Me.cancellationToken IsNot Nothing Then 'Cancellation request. Me.cancellationToken.Cancel() End If End Sub 'Open the selected post in the default browser. Private Sub TextBlock_MouseLeftButtonUp(sender As Object, e As MouseButtonEventArgs) Dim content = CType(sender, TextBlock) Dim link = CType(content.Tag, Uri) Process.Start(link.AbsoluteUri) End Sub |
Figure 53 shows an example of how the data is retrieved and presented in the UI.
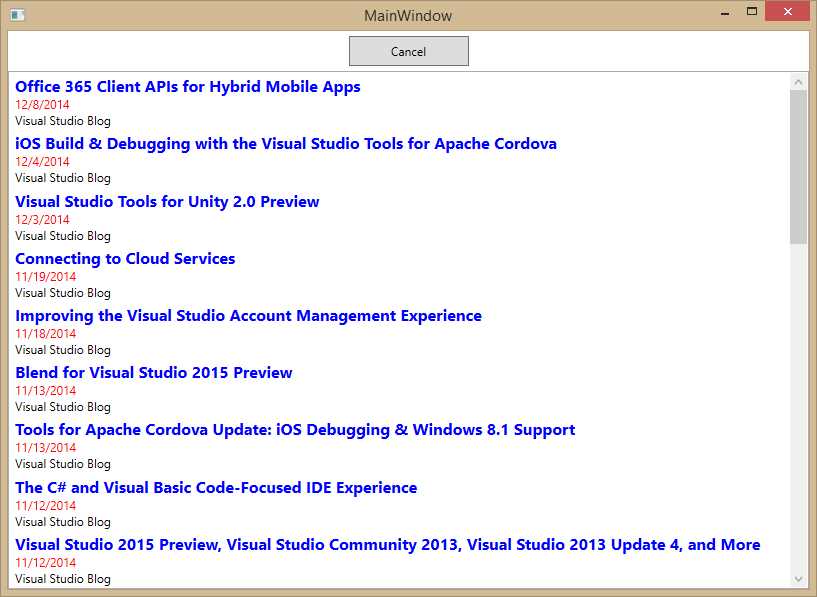
- Downloading and presenting the RSS feed contents.
Debugging With PerfTips
To understand PerfTips, place three breakpoints on the following (see Figure 54):
- The instance declaration of the HttpClient class.
- The line that invokes XDocument.Parse.
- The line that returns the query result.
Note: For the sake of simplicity, from now on all figures will be based on the C# version of the sample application. However, the same concepts, steps, and results apply to Visual Basic as well.

- Adding some breakpoints.
Press F5 to start debugging. The debugger will break before accessing the RSS feed. With PerfTips you can now measure how long it takes between downloading data from the feed and before the application starts analyzing downloaded data. Press F5 again; when the debugger encounters the second breakpoint, it breaks the execution and shows a small piece of information regarding the elapsed time in milliseconds. If you hover over that information, a more detailed tooltip appears. Figure 55 shows both features.

- Measuring time of code execution with PerfTips.
If you now continue the execution by pressing F5, you will be able to measure the code execution until the next breakpoint (see Figure 56). In this particular case, you can see how long it took to execute a LINQ query against the downloaded feed data.
Note: Remember that the elapsed time also includes some debugger overhead. This is because the debugger execution affects performances in some way, so the elapsed time is always a little bit higher than the real execution time.

- Measuring another piece of code with PerfTips.
You are not limited to use PerfTips with breakpoints. In fact, you can get performance information with other debugging options, such as executing code line by line with Step Into by pressing F11, or when stepping through the code with Step Over (F10), Step Out (Shift + F11), or Run to Cursor (CTRL+F10).
Diagnostic Tools
Visual Studio 2015 Enterprise edition includes a new tool called Diagnostic Tools, which allows analyzing where and how your application consumes resources. Diagnostic Tools is available as a tool window that automatically shows up when you start debugging an application. Among the others, you can analyze CPU utilization, memory usage, and debugger events. Figure 57 shows an example of this.

- Analyzing application performances with Diagnostic Tools.
The Diagnostic Tools window has a timeline that is populated with information as the application’s execution goes on. It shows debugger events such as exceptions and breakpoints, but it also integrates with IntelliTrace events. You can also perform advanced memory analysis by selecting the Memory Usage tab (see the bottom of Figure 57) and taking memory snapshots. When you get some, you can click on the total number of objects instantiated at a certain time to see the full list of objects and how many instances are active for each object. You can disable (or enable) the Diagnostic Tools window at any time by selecting Tools > Options > Debugging > Diagnostic Tools. Additionally, you can manually open Diagnostic Tools via Debug > Show Diagnostic Tools. At the moment of writing this chapter, Diagnostic Tools does not support ASP.NET 5 Core projects, JavaScript 64-bit Windows Store apps, and remote debugging.
Managing Breakpoints with Breakpoint Settings
When placing breakpoints in the preview sample applications, you probably noticed a small toolbar appearing near the red glyph. This small toolbar allows access to breakpoint settings with a completely new experience, as shown in Figure 58.

- The new toolbar for breakpoint settings.
This toolbar has a button for disabling breakpoints but, most importantly, it offers another button for quickly customizing breakpoints. Breakpoints settings now appear as a non-modal, peek window directly inside the code editor, as represented in Figure 59.

- Breakpoint settings now appear as a peek window.
The settings you can edit are largely the same, but what Visual Studio 2015 changes is the way you access and edit settings, which is directly inside the code editor; this is a new, non-blocking approach that allows you to write code with breakpoint settings open. You can still set Conditions and Actions. Conditions control when the breakpoint must be hit; the default condition is that the breakpoint is hit when the code execution reaches its location. Actions control what the debugger should do when all conditions are satisfied. The default action is that the debugger stops the code execution. For example, you might want to stop the execution of the sample application only when the result of downloading data from the RSS feed is null and, if it happens, you might want to send to the output window the call stack. You can use a condition like the one shown in Figure 60 where the actualData == null expression must be equal to true. It is worth mentioning that you will have IntelliSense available when writing your conditions. You can set an action invoking the $CALLSTACK function which will print the entire call stack into the Output window.

- Specifying conditions and actions.
Tip: When providing actions, a specialized IntelliSense will help you choose among available functions and a tooltip will describe each of them.
Concerning conditions, you can select one among Conditional Expression, Hit Count, and Filter. As the name implies, a Conditional Expression will make the breakpoint to be hit only when the specified expression evaluates to True or When Changed. If you instead have iterations (e.g. for loops) and you want a breakpoint to be hit only at the specified iteration, you can use Hit Count and specify that the iteration number must be =, Multiple of, or >= than the specified value. This is useful when you discover that an error occurs only from a certain point in the application execution. You can instead use Filter to specify devices, processes, or threads that a breakpoint executes on.
Note: Breakpoint settings are not different from previous editions. The difference is in the way you access and edit settings. In this book, we focus on what’s new in the developer experience, so you might want to check the MSDN documentation for more details about available settings and conditions.
Conditions and actions can either work together or separately. Without a doubt, the new experience is awesome because you can easily manage breakpoint settings without ever losing focus on your code.
Chapter Summary
In this chapter you learned about how the Error List tool window has been revisited with error codes, hyperlinks, and advanced filtering options. Then you saw how many investments have been made to the debugging tools, including the option of debugging lambda expressions and LINQ queries in Watch and Immediate windows; you also learned how you can measure code performances with PerfTips and Diagnostic Tools, and how to control breakpoint settings with the new non-blocking, non-modal, and peek window-based experience. All these important features will increase your productivity and will definitely help you write better and more performant code.
- 1800+ high-performance UI components.
- Includes popular controls such as Grid, Chart, Scheduler, and more.
- 24x5 unlimited support by developers.