
Visual Studio for Mac Succinctly®

CHAPTER 3
Debugging Applications
Debugging is one of the most important parts of the development application life cycle, and Visual Studio 2019 for Mac offers unified, powerful tools for all the supported types of applications. This chapter walks through the available tools and provides useful tips.
Available debuggers
Visual Studio 2019 for Mac leverages debuggers that ship with the two major frameworks it relies on. For .NET Core, Visual Studio relies on the Microsoft .NET Core Debugger, which is included in the .NET Core SDK you installed in Chapter 1. This is the same debugger used by environments such as Visual Studio Code and Visual Studio on Windows against .NET Core apps. For Xamarin, Visual Studio leverages the Mono Soft Debugger, a specific debugger for Mono. Its main characteristic is that it is an integrated debugger built into the Mono framework, which is different from most debuggers, which are stand-alone processes.
The goal of this chapter is not to explain what happens behind the scenes of the debuggers. Rather, it is to explain the powerful, unified tools that the IDE provides to debug applications regardless of the backing debugger. Obviously, Android and iOS are two different systems and therefore, the Mono Soft Debugger will send different kinds of messages depending on the current platform. The same concept applies to the Microsoft .NET Core Debugger, whose behavior is totally different from Mono Soft, and which will show its own messages and have its own characteristics.
Setting up an example
Before you learn about all the powerful debugging tools, it is necessary to write some code containing intentional errors that can be used for demonstration purposes. By following the steps you saw in Chapter 2, create a new .NET Core console application in C# and write the code shown in Code Listing 1.
Code Listing 1
The code is very simple: it shows a message stored inside a variable and then tries to read the content of a text file that will be shown on-screen, assuming the file exists. Notice that storing a message inside a variable rather than passing it directly as an argument to Console.WriteLine and missing a try..catch block to handle I/O exceptions are intentional errors, and are required to demonstrate how to leverage some of the debugging tools in the IDE.
Note: From now on, you will start either the sample application or any application you want to use for learning purposes with an instance of the debugger attached. As you learned in Chapter 2, this is accomplished via Run > Start Debugging or via the Start button on the standard toolbar.
Reading the output from the debugger
During the whole application lifecycle, Visual Studio shows any messages that the debugger sends in the Application Output pad. Figure 30 shows an example based on the sample code provided previously, where you can also see how the debugger captured an exception.
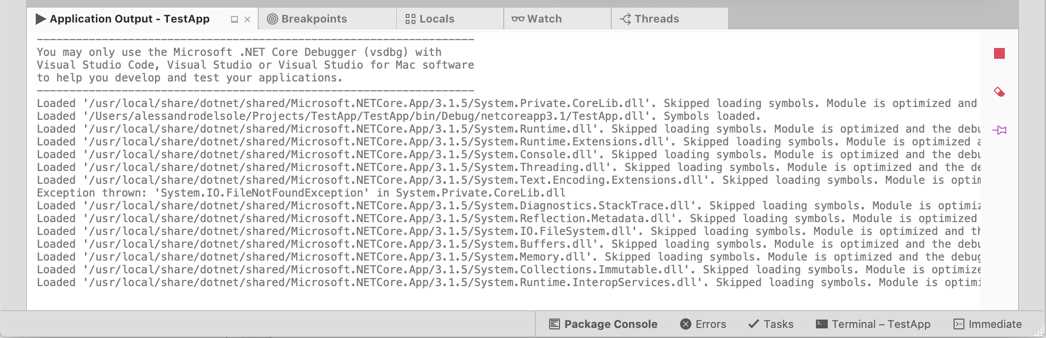
Figure 30: The Application Output pad
The Application Output pad is of crucial importance when debugging, because it shows all the flow of information that the debugger sends. This is of particular importance in case of runtime problems and exceptions raised by your application, or errors that the system might encounter when hosting your application. As with any other pads, the Application Output pad can auto-hide and be docked to a different position in the IDE for your convenience.
Working with breakpoints and data visualizers
Breakpoints are probably the debugging tool you will use most frequently. They basically allow you to control the execution flow of your applications. A breakpoint causes an application to break its execution at the point where the breakpoint itself was placed. This is also known as break mode. When a breakpoint is hit and the application execution breaks, you can take the necessary actions, such as investigating variable values at that point of the execution or executing code line by line. The easiest way to add a breakpoint is by clicking the left-most column in the code editor, corresponding to the line of code at which you want the application execution to break. A breakpoint highlights the line of code in red, as shown in Figure 31.
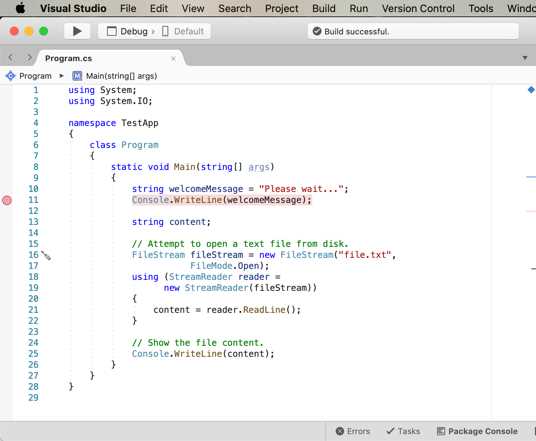
Figure 31: Breakpoints highlight in red a line of code
You can add multiple breakpoints in different code files in order to control the execution flow. Now start debugging the application to see how breakpoints work. When the debugger encounters a breakpoint, it breaks the execution and highlights in yellow the line of code that is being debugged, before the line is executed, as demonstrated in Figure 32.
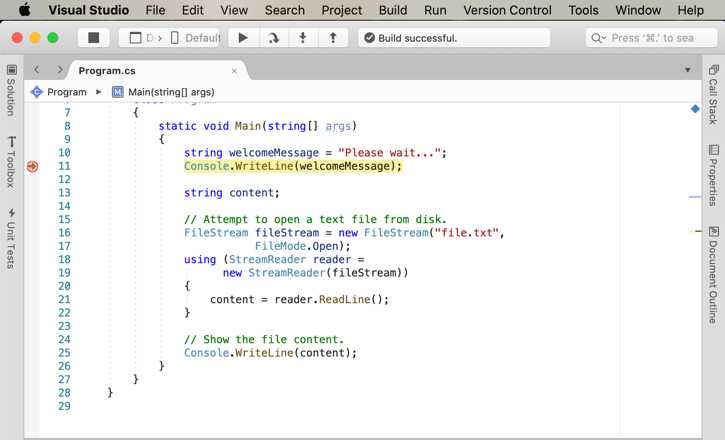
Figure 32: A breakpoint has been hit
Once the breakpoint has been hit and the line of code is highlighted in yellow, you can perform many actions, such as debugging in steps (discussed shortly). Visual Studio 2019 for Mac introduces a new debugging feature, which allows you to set the next instruction to be executed while in break mode. If you look at Figure 31, you can see a red arrow that overlays the glyph of the breakpoint. You can move the arrow with the mouse to the line you want to be executed next, as demonstrated in Figure 33, which moves the execution flow to the previous line, the assignment of the welcomeMessage variable. Debugging will now continue from that line.
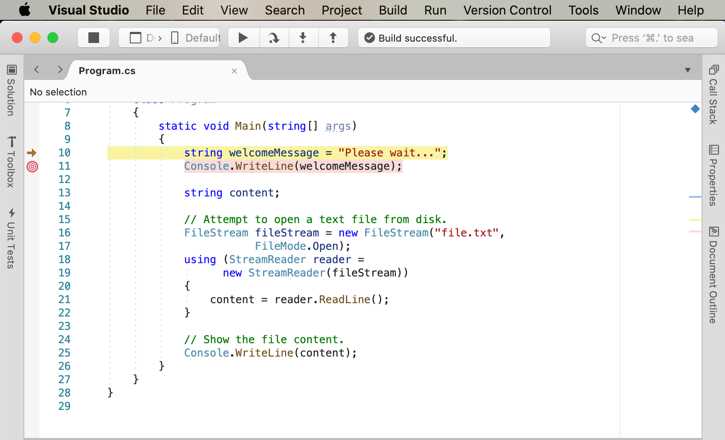
Figure 33: Setting the next line to be executed while in break mode
Visual Studio 2019 for Mac allows for investigating the content of objects and variables with the so-called data visualizers. Data visualizers are small pop-ups that appear when you hover over a local variable, field, or property, and that display their contents at that particular point in time. For example, if you hover over the welcomeMessage variable, you will see a data tip that shows its value (see Figure 34).
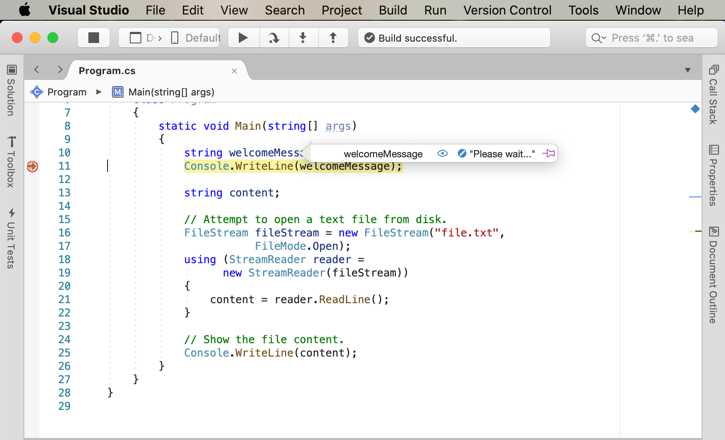
Figure 34: Investigating variables with data visualizers
In this case, the value for welcomeMessage has been supplied in code, but data visualizers are extremely useful when variables contain the result of a calculation or of the evaluation of an expression, and they allow you to see if the actual value is the expected result. If not, you can perform additional investigations to see what the problem was. You can also pin a data visualizer to the code editor by clicking the icon at its right side.
Data visualizers are also available in the Locals pad, discussed shortly. You will use data visualizers many times while debugging, because they quickly help you understand if objects are populated as expected. For now, just press Start in the toolbar to resume the application execution. In the next section, you will learn more about executing code in steps.
Configuring breakpoints
Breakpoints can be configured so that you can decide when and how they should condition the application execution. If you right-click the red glyph of a breakpoint and then select Edit Breakpoint, you will access the Edit Breakpoint dialog. Here you can specify conditions and actions. Conditions determine when the debugger should break the application execution when it encounters a breakpoint, whereas actions allow special tasks to occur when a breakpoint is hit. They can work together to give you maximum control over the execution flow. Figure 35 shows how the Edit Breakpoint dialog appears.
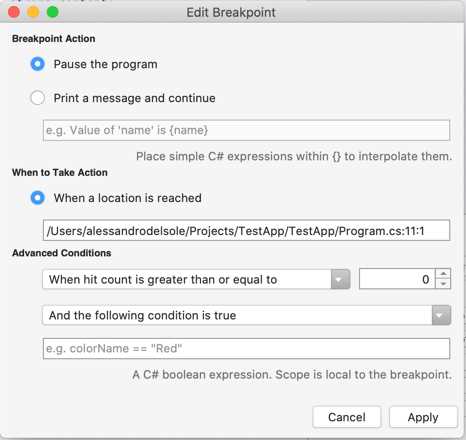
Figure 35: Editing a breakpoint’s configuration
In the Breakpoint Action group, the default selection is Pause the program, which simply causes the debugger to break the application execution when a breakpoint is hit. This is the behavior you saw when running the sample code after placing a breakpoint. As an alternative, the Print a message and continue option will not break the application execution; instead, it will show a message in the Application Output pad. The interesting thing is that, in the message, you can interpolate any C# expression within curly braces, which is useful to evaluate the value of a variable or of an object’s properties. In the When to Take Action group, there is only one option, called When a location is reached. The value of this setting is the file name and line of code where the breakpoint is currently placed, and since this is a read-only setting, you cannot change it.
About conditions: by default, the application enters into break mode every time a breakpoint is encountered. However, sometimes you might want to place breakpoints but break the application execution only if a certain condition is true.
For example, if you are iterating a collection with a foreach loop, you might want to break the application execution only after a certain number of iterations. To accomplish this, you can select one of the available conditions from the Advanced Conditions combo box (see Figure 29). You can see how the name of each condition starts with When hit count is. With “hit,” we mean each time a breakpoint is encountered, and therefore, the application execution should stop. In other words, conditions allow you to control the hit’s behavior.
For example, the When hit count is greater than or equal to condition will cause the application execution to break only after a breakpoint has been hit a number of times that is greater than or equal to the number that you specify with the selector on the right. Other condition names are self-explanatory, and the behavior of each condition is similar, except that the condition will be less than or greater than.
You can also specify additional conditions with the And the following condition is true and And the following expression changes options. The first option allows you to specify a C# expression that must be evaluated to true in order to break the application execution, whereas the second option allows you to decide that an application should enter break mode when the value of the supplied C# expression changes. In summary, conditions and actions are very useful when you want a breakpoint to be hit only under certain circumstances, and they allow for a better execution flow.
Function and exception breakpoints
Previously, you saw how to add a breakpoint the easy way, and then you saw how to edit a breakpoint with conditions and actions. Visual Studio 2019 for Mac also allows you to specify conditions and actions, and also other options, directly when adding a new breakpoint by right-clicking the left-most column in the code editor and then selecting New Breakpoint. This will open the Create a Breakpoint dialog, which looks like Figure 36.
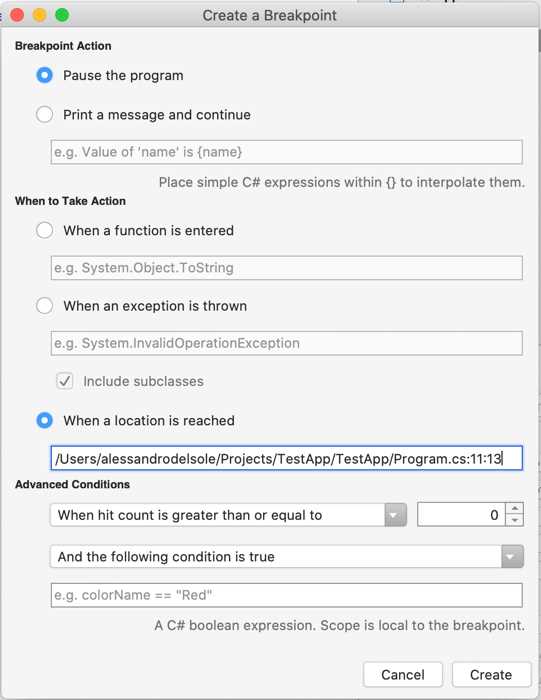
Figure 36: Function and exception breakpoints
Most of the options are the same as we discussed for the Edit Breakpoint dialog. Additionally, you will find the following two actions in the When to Take Action group: When a function is entered and When an exception is thrown (the default action is hitting the breakpoint when it’s encountered). The first action is also referred to as a function breakpoint, whereas the second option is also referred to as an exception catchpoint.
A function breakpoint will cause the debugger to break the application execution when the specified method call is invoked, regardless of its position in the code. An exception catchpoint will cause the debugger to break the application execution when the specified exception is thrown at runtime, regardless of where it happens. The very interesting thing is that both options are unrelated to any line of code; they will act as breakpoints, but they really do not need a breakpoint in the code editor. Visual Studio keeps track of function breakpoints and exception catchpoints and allows you to control them in the Breakpoints pad, as you will discover shortly. When you’re ready, click Create and a breakpoint will be placed on the current line of code.
Analyzing runtime errors
Runtime errors happen during the application execution, and they are typically due to programming errors that are not visible at compile time and that might involve unpredictable situations. For example, if an application gives users the ability to read a file, but then the file is not found on disk, a runtime error will occur. As an additional example, if an application attempts to connect to a database that is unreachable for network connectivity issues, a runtime error will occur.
Obviously, in real-life applications, it is your responsibility, as the developer, to predict such possibilities and implement the appropriate error-handling code blocks. However, unhandled runtime errors might occur for various reasons and the debugger in Visual Studio 2019 for Mac offers the proper tools to help you understand the cause of the problem.
If you run the sample code provided at the beginning with no breakpoints, after a few seconds, a runtime error will cause the debugger to break the application execution, because the code is searching for a file that does not exist. At this point, Visual Studio highlights the line of code that caused the error and will show a tooltip that contains the exception name and the error description, as shown in Figure 37.
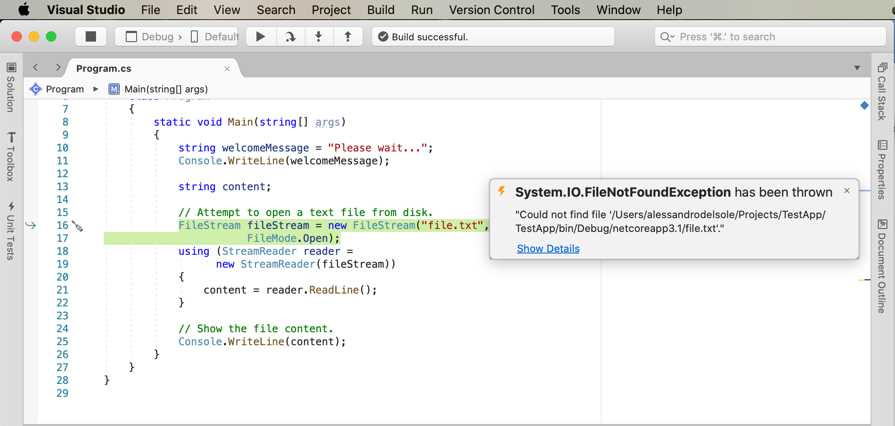
Figure 37: Details about runtime exceptions
In this case, the code failed because it was searching for a file that does not exist, so a FileNotFoundException error was thrown and was not handled by any try..catch block; therefore, the execution of the application was broken. Visual Studio shows the name of the exception that was raised and the file name that was not found (this is included in the exception message). Actually, Visual Studio allows you to investigate an exception further and retrieve all the details that the debugger was able to collect. To accomplish this, click Show Details, which opens the Exception Caught dialog (see Figure 38).
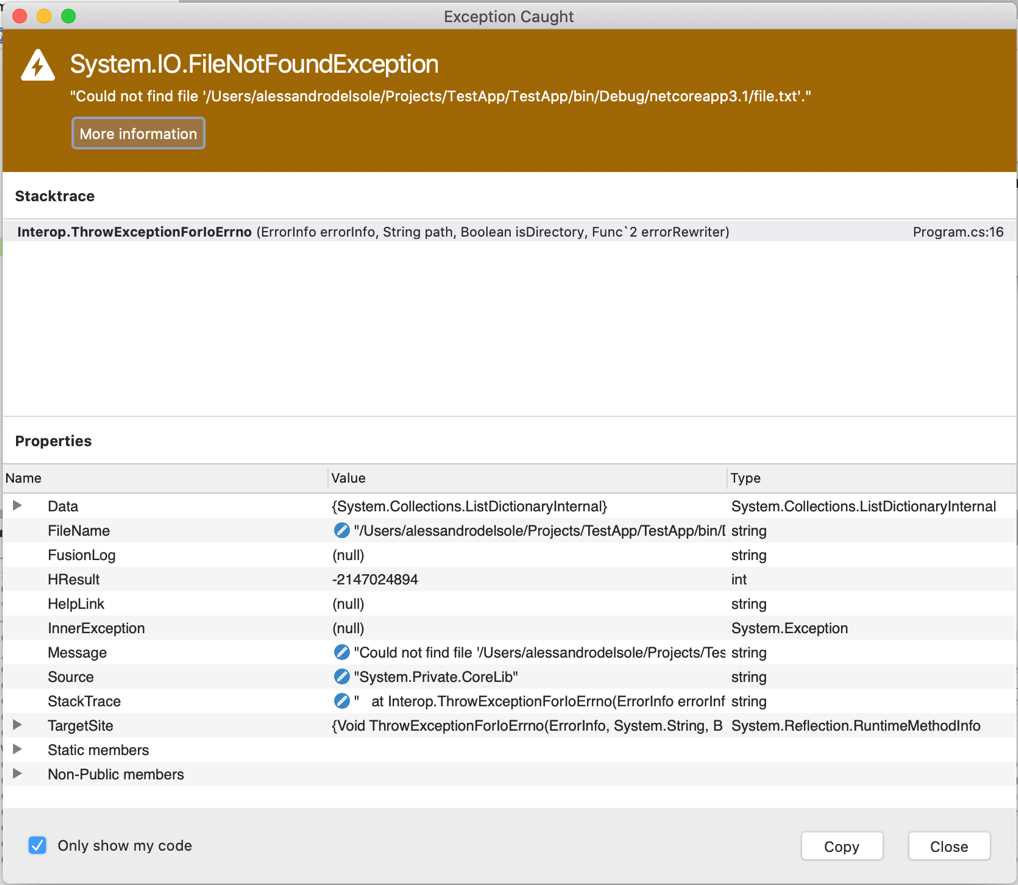
Figure 38: Viewing an exception’s details
The Exception Caught dialog shows all the information about the exception and, because an exception is a .NET type that inherits from System.Exception, you will see the list of the exception properties, depending on the specialized exception type (in the case of a FileNotFoundException, you will see the FileName property showing the file that was not found).
At the top of the dialog, the StackTrace item shows the hierarchy of calls to classes and methods that effectively produced the error. By default, StackTrace only shows information from your code, so if you want to see the entire call hierarchy, you need to disable the Only show my code option at the bottom.
The InnerException property is also very useful. In our particular case example, it is set to null, but it’s not unusual for this item to show an exceptions tree that enables you to better understand what actually caused an error. The Exception Caught dialog also allows you to investigate property values further with data visualizers, so you can hover over a property name or its value and enable the proper visualizer.
Executing code in steps
When the application execution breaks, such as when the debugger encounters a breakpoint, you have different options to continue the execution. For instance, you can completely resume the execution, or you can just execute one line of code at a time or small sets of lines of code at a time. To accomplish this, you use a number of commands that are available in the Run menu, in the debugging toolbar (and through the related keyboard shortcuts), or in the context menu of the code editor. These commands are described in Table 4.
Commands to execute code in steps | |
|---|---|
Command | Description |
Continue debugging | Resumes the application execution from the point at which it broke. |
Step Into | Executes one instruction at a time. It is similar to Step Over, but if the instruction to be executed is a method, the method is executed one instruction at a time and, when finished, the execution goes back to the caller. |
Step Over | Executes one instruction at a time. The difference from Step Into is that if the instruction to be executed is a method, the debugger does not enter the method and completes its execution before going back to the caller. This can be useful when you need to debug a portion of code that invokes several methods you already tested and do not need to delve into each one. |
Step Out | Executes all lines of a method next to the current one, until the method completes. Step Out does not work outside of methods. |
Run To Cursor | Allows running all the code until the selected line. You call it by right-clicking a line of code and then selecting Run To Cursor. |
Set Next Statement | Within a code block, allows setting the next statement to be executed when resuming the application execution after a breakpoint or stop. |
Show Next Statement | Moves the cursor to the next executable statement. This can be useful if you have long code files and breakpoints are not immediately visible. |
Show Current Execution Line | Moves the cursor to the current statement. Useful with long code files when the cursor is in a totally different place. |
The Run To Cursor, Set Next Statement, Show Next Statement, and Show Current Execution Line commands are not available in the Debug toolbar. You can find them in the Run menu or by right-clicking the code editor.
The Debug pads
In order to make it easier to analyze an application’s behavior, Visual Studio for Mac provides special pads that you can use while debugging. Visual Studio automatically shows these pads when you start debugging an application. If you decide to close one or more pads while debugging, you can always re-enable them individually with View > Debug Pads, and you can also enable them all with View > Debug.
The Breakpoints pad
The Breakpoints pad provides a visual representation of all the breakpoints in a solution, plus a number of shortcuts that make it easier to add, edit, and remove breakpoints. Figure 39 shows an example where you can see a breakpoint and an exception catchpoint.
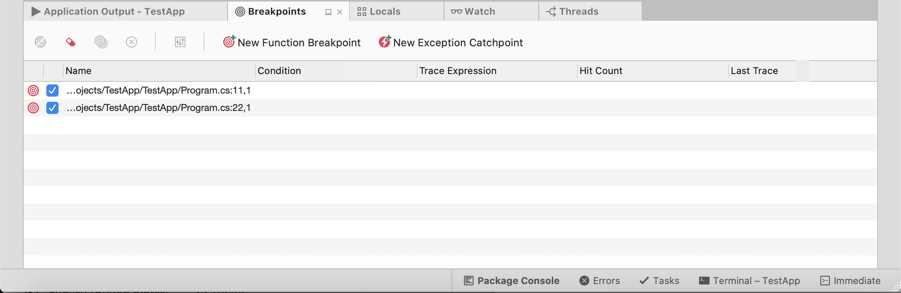
Figure 39: The Breakpoints pad
The Breakpoints pad shows the list of breakpoints, function breakpoints, and exception catchpoints, each recognizable by a specific icon. For breakpoints, it shows the code file, the line number, and the hit count if a condition has been specified. While debugging, the hit count will increase every time the breakpoint is encountered. You can double-click a breakpoint and the code editor will move the cursor to the line where the breakpoint is. You can also disable one or more breakpoints using the check box on the left side. The pad’s toolbar has a button that allows you to disable, remove, edit, and add breakpoints.
The Locals pad
The Locals pad shows the active local variables and their values while debugging. Figure 40 shows an example where you can see active variables for the sample code provided previously when stepping into the Main method. For example, you can see how the value for the welcomeMessage variable is a Please wait… message. This is very useful, especially with local variables whose value is the result of an evaluation or assignment.

Figure 40: The Locals pad
For each variable, the Locals pad shows not only the name and value, but also the type. When a variable has not been initialized, it shows the default value (such as null for reference types or zero for integers). You can hover over a variable and view its content with data visualizers, and you can even change a variable’s value by double-clicking each one. In the Locals pad, data visualizers also show an appropriate preview based on the variable type. For instance, if a variable represents a color, the data visualizer will show a box that depicts the color and shows the RGB properties, not just the C# value. Specific previews are available for types that represent location coordinates, images, size, points, Bezier curves, collections that implement the IEnumerable interface, and of course, strings.
The Watch pad
The Watch pad allows for monitoring object variables, methods, or expressions so that you can monitor what a variable is doing. When in break mode, you can enter the Watch pad and type in the name of a variable. Visual Studio will show the value for the variable at that specific time (see Figure 41).
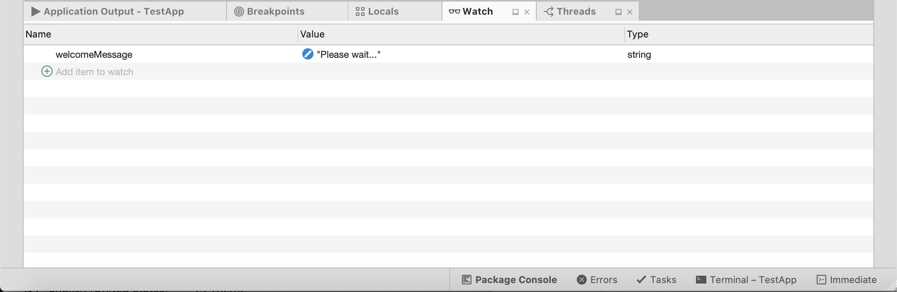
Figure 41: The Watch pad
You need to step into the code and wait for an expression to be evaluated and assigned to the variable you entered in the Watch pad. The pad will be updated every time the result of the evaluation changes. It is worth mentioning that Visual Studio 2019 introduces the option to watch a variable by right-clicking the name in the code editor and then selecting Add Watch.
The Call Stack pad
The Call Stack pad allows you to view the hierarchy of method calls. By default, Call Stack shows only calls in your code, but you can right-click and select Show External Code to see calls to external code such as native functions. Figure 42 shows an example based on the application code, with no external code.
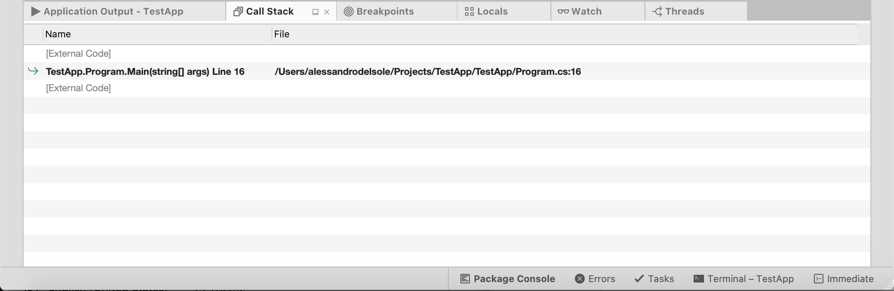
Figure 42: The Call Stack pad
You can right-click the view and select a number of options, such as Show External Code, to visualize calls to native functions, or you can select Columns > Language to see the programming language with which a method was written. Call Stack is particularly useful with exceptions, because it helps walk you through the hierarchy of method calls so that you can understand the actual origin of the exception.
The Threads pad
As you know, many applications can run multiple threads, and this is also true for .NET Core and Xamarin applications. In order to get a view of running threads, you can open the Threads pad. It shows a list of running threads with summary information such as the thread ID, the name (where available), and a reference to the code that is related to that thread (see Figure 43).
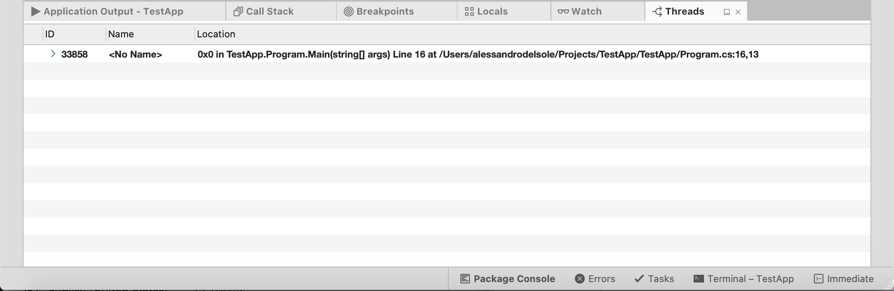
Figure 43: The Threads pad
This pad can be useful with multithreaded applications when you need to understand to which thread a specific code block is referring.
Chapter summary
In this chapter, you have walked through important features such as breakpoints, which allow you to control the execution flow of your code, and commands that allow you to execute your code step by step. With the help of data visualizers, you can always investigate variables’ contents while debugging. VS 2019 for Mac also provides a number of pads that are specific for debugging, and in this chapter, you saw which pads are available and what you can do with them to analyze your code and your applications’ behavior. You now have all the necessary knowledge about working with Visual Studio’s IDE, and now you can finally start putting your hands on some code.
- 1800+ high-performance UI components.
- Includes popular controls such as Grid, Chart, Scheduler, and more.
- 24x5 unlimited support by developers.