
Visual Studio Code Succinctly®

CHAPTER 2
The Workspace and the User Interface
The user interface and layout in Visual Studio Code are optimized to maximize the space for code editing. In addition, it provides easy shortcuts to quickly access all the additional tools you need in a given context, offering an awesome experience. More specifically, the user interface is divided into four areas: The code editor, the status bar, the view bar, and the side bar. This chapter explains how the user interface is composed and how you can maximize your productivity with it.
Tip: Most of the tools described in this chapter have buttons with just icons and no text. However, buttons have names that you can see by hovering over them with the pointer.
The code editor
The code editor is definitely the area where you spend most of your time. You can edit one file at a time as you saw in Chapter 1, but you can also open up to three code files side-by-side. Figure 42 shows an example.
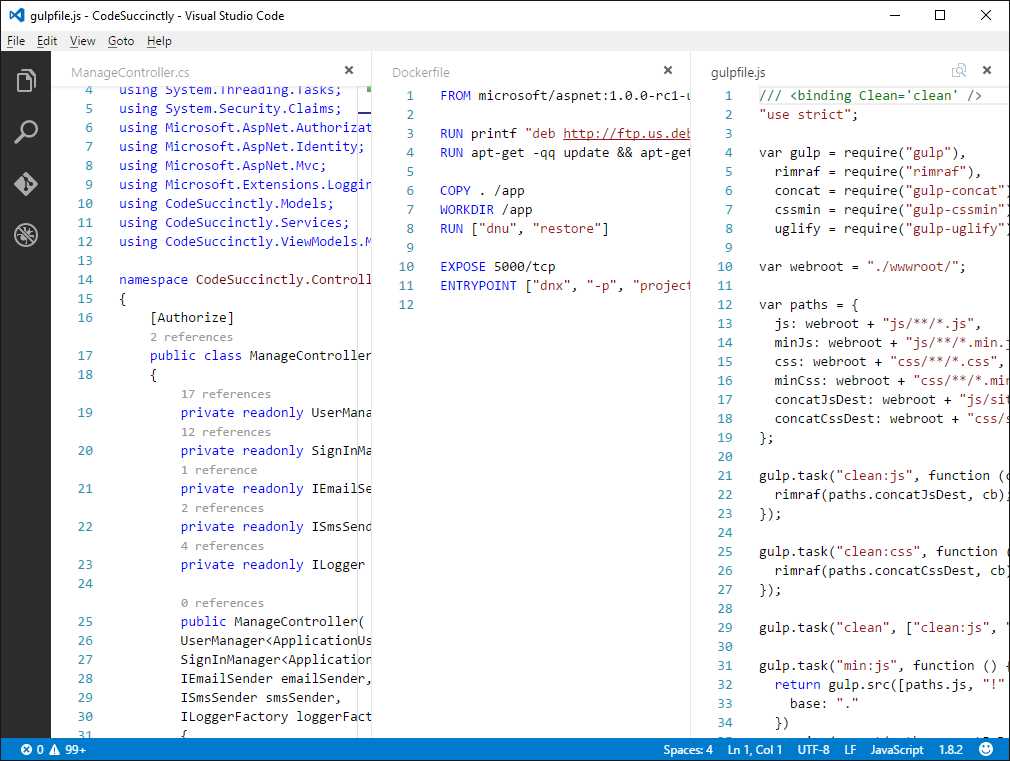
Figure 42: The code editor allows opening up to three code files.
To do this, you have a couple options:
- Right-click a file name in the Explorer bar and then select Open to Side.
- Hold Ctrl and click on a file name in Explorer.
- Press Ctrl+\ to split the editor in two.
Notice that if you already have three files open and you want to open another file, the editor that is active will display that file. You can quickly switch between editors by pressing Ctrl+1, Ctrl+2, and Ctrl+3.
Resizing and reordering editors
Editors can be resized and reordered. Resizing an editor can be accomplished by clicking the left mouse button over an editor’s border when the pointer appears as a pair of left and right arrows. Reordering editors is done by clicking an editor’s header, where the file name is displayed, and moving it to a different position.
Zooming editors
You can easily zoom in and out of the active editor by pressing Ctrl+Plus Sign and Ctrl+Hyphen respectively. Alternatively, you can select View > Zoom in and View > Zoom out. Notice that this is an accessibility feature, so when you zoom the code editor, the view bar and side bar will also be zoomed.
The status bar
The status bar contains information about the current file or folder and allows you to perform some quick actions. Figure 43 shows an example of how the status bar appears.
![]()
Figure 43: The status bar
From left to right, you find the following information:
- Git version control information and options, such as the current branch and the Synchronize Changes button.
- Errors and warnings. You already saw this in the Code Issues and Refactoring section in Chapter 1.
- Indentation. This is the Spaces: 4 item in Figure 43. You can click this to change the indentation size and to convert indentation to tabs or spaces.
- The cursor's position expressed in line and column numbers.
- The current file encoding.
- The current line terminator.
- The language for the open file.
- The project name if you open a folder that contains a supported project system. It is worth noting that, in case the folder contains multiple project files, clicking this item will allow switching between projects.
- The feedback button, which allows sharing your feedback about Visual Studio Code on Twitter.
The status bar is blue if you open a folder or violet if you open a single file.
The view bar
The view bar is placed at the left side of the user interface and provides quick access to four tools. Figure 44 shows the view bar.

Figure 44: The View Bar
The view bar can be thought of as a collapsed container for the side bar, and it provides shortcuts to the following tools: Explorer, Search, Git, and Debug, which are described in the next sections.
The side bar
The side bar is the most important companion for the code editor. It is composed of the four tools described in the next paragraphs. Each is enabled by clicking its corresponding icon.
The Explorer bar
You already encountered the Explorer bar in Chapter 1. It provides a structured, organized view of the folder or files you are working with. The Working Files subview contains the list of active files, including open files that are not part of a project, folder, or files that have been modified. These are instead shown in a subview whose name is the folder or project name. Figure 45 provides an enhanced example of the Explorer.

Figure 45: The Explorer Bar
The subview that shows a folder structure provides four buttons from left to right: New File, New Folder, Refresh, and Collapse. The function of each is self-explanatory. The Working Files subview has two buttons: Save All and Close All Files. Right-clicking a folder or file name in Explorer provides a context menu that offers common commands, such as the Open to the Side option mentioned at the beginning of this chapter. A very interesting command is Reveal to Explorer (or Reveal to Finder on Mac and Open Containing Folder on Linux), which opens the containing folder for the selected item. Notice that the Explorer icon in the view bar reports the number of modified files.
Searching across files
The Search tool allows searching across files. You can search for one or more words, including special characters such as * and ?, and you can even search based on regular expressions. Figure 46 shows the Search tool in action with advanced options expanded (the Files to include and Files to exclude text boxes).
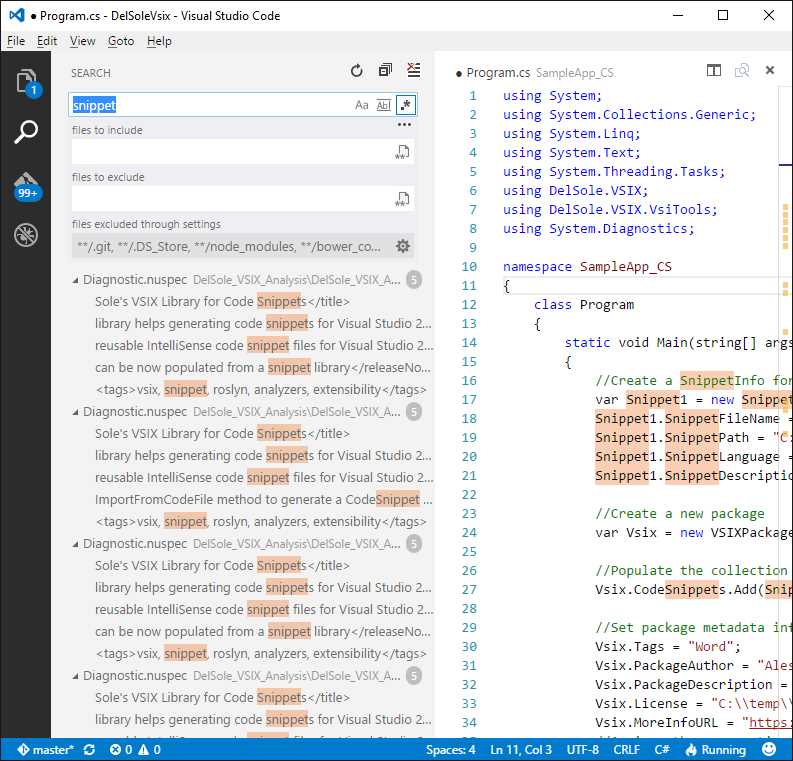
Figure 46: Searching Across Files
Search results are offered in a hierarchical view that groups all the files that contain the specified search key, and shows an excerpt of the line of code that contains it. Occurrences are highlighted in both the list of files and in the code editor. When you are done, you can clean up search results by clicking the Clear Search Results button.
Git and Debug
The side bar also provides access to two special and important tools in Visual Studio Code: Git integration for version control and the integrated debugger. Because both are described inside dedicated chapters later, I will not cover them here. However, for the sake of completeness, Figure 47 provides a glimpse of Git that also shows file differences, and Figure 48 shows an empty Debug area.
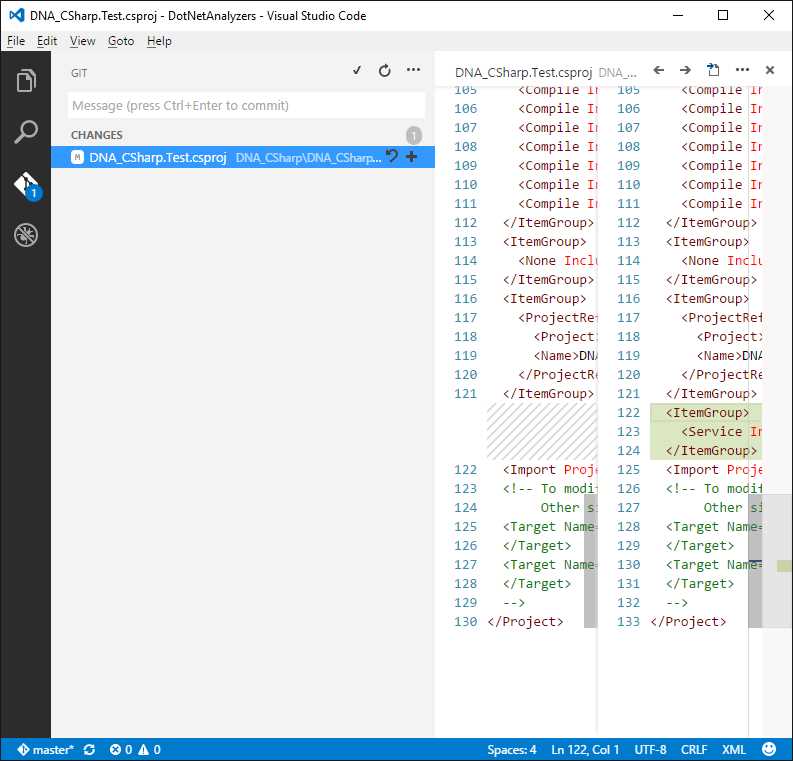
Figure 47: Git and the File Diff Tool
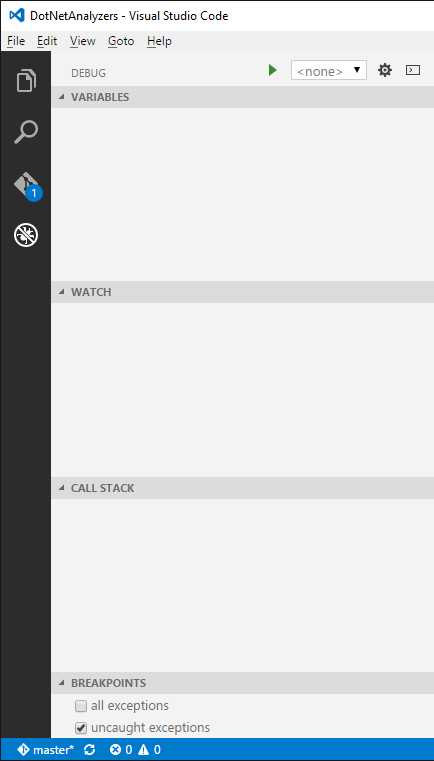
Figure 48: The Debug Area
Quick file navigation
Visual Studio Code provides two ways of navigating between files. If you press Ctrl+Tab, you will be able to browse the list of files that have been opened since Code was launched and you will be able to select one for editing, as shown in Figure 49.
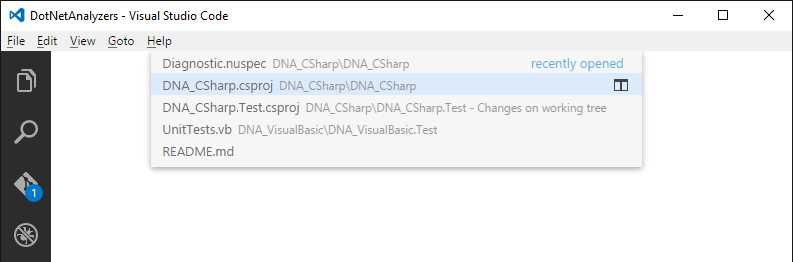
Figure 49: Browsing the List of Recently Opened Files
When you release the Tab key, the selected file is opened for editing. The second way is to press Alt+Left Arrow Key or Alt+Right Arrow Key to switch between active files.
The Command Palette
The Command Palette is an important tool that allows executing special commands. You enable the Command Palette by clicking View > Command Palette or by pressing either F1 or Ctrl+Shift+P. Figure 50 shows the Command Palette.
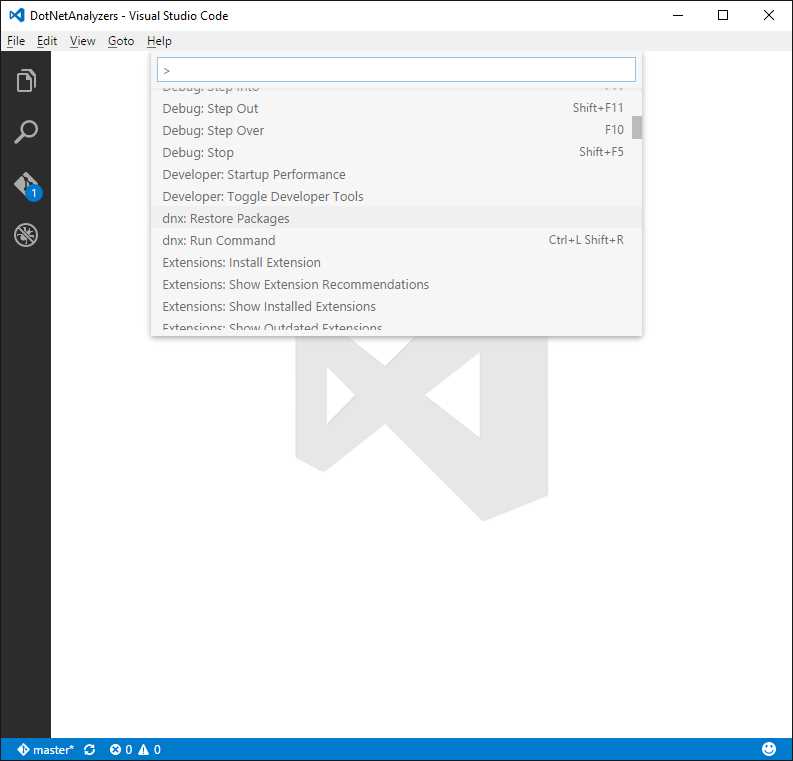
Figure 50: The Command Palette
The Command Palette is basically an easy way to access all of Visual Studio Code’s functionalities via the keyboard. This is not just related to menu commands or user interface instrumentation, but also other actions that are not accessible elsewhere. For instance, the Command Palette allows installing extensions as well as restoring NuGet packages over the current project or folder. You can move up and down the list to see all the available commands, and you can type characters to filter the list. You will notice many commands map actions available within menus. Other commands, such as extension, debug, and Git commands, will be discussed in the next chapters so it is important that you get started with the Command Palette at this point.
Chapter summary
The user interface in Visual Studio Code is optimized to maximize the available space for editing. The workspace is divided into four areas. The code editor is where you write code and where you can open up to three files concurrently. The status bar reports summary information about the file or folder. The view bar is a collapsed container for the side bar that offers four important tools: Explorer, Search, Git, and Debug. Explorer provides an organized view of files and folders, while Search allows searching across files with advanced options. Git and Debug will be discussed in the next chapters. Visual Studio Code offers another important tool, the Command Palette, where you can browse the list of available commands, including those you execute against projects, folders, and files directly.
- 1800+ high-performance UI components.
- Includes popular controls such as Grid, Chart, Scheduler, and more.
- 24x5 unlimited support by developers.